The Great Housing Reset: How the Mortgage Rate Lock-In Effect Is Finally Breaking Down
After 3 years of unprecedented stagnation, the U.S. housing market is experiencing a fundamental structural shift that will reshape opportunities for homebuyers, sellers, and real estate professionals throughout 2026 and beyond. The catalyst? The erosion of the pandemic-era "mortgage rate lock-in effect" that has kept millions of homeowners frozen in place since rates began climbing in early 2022.
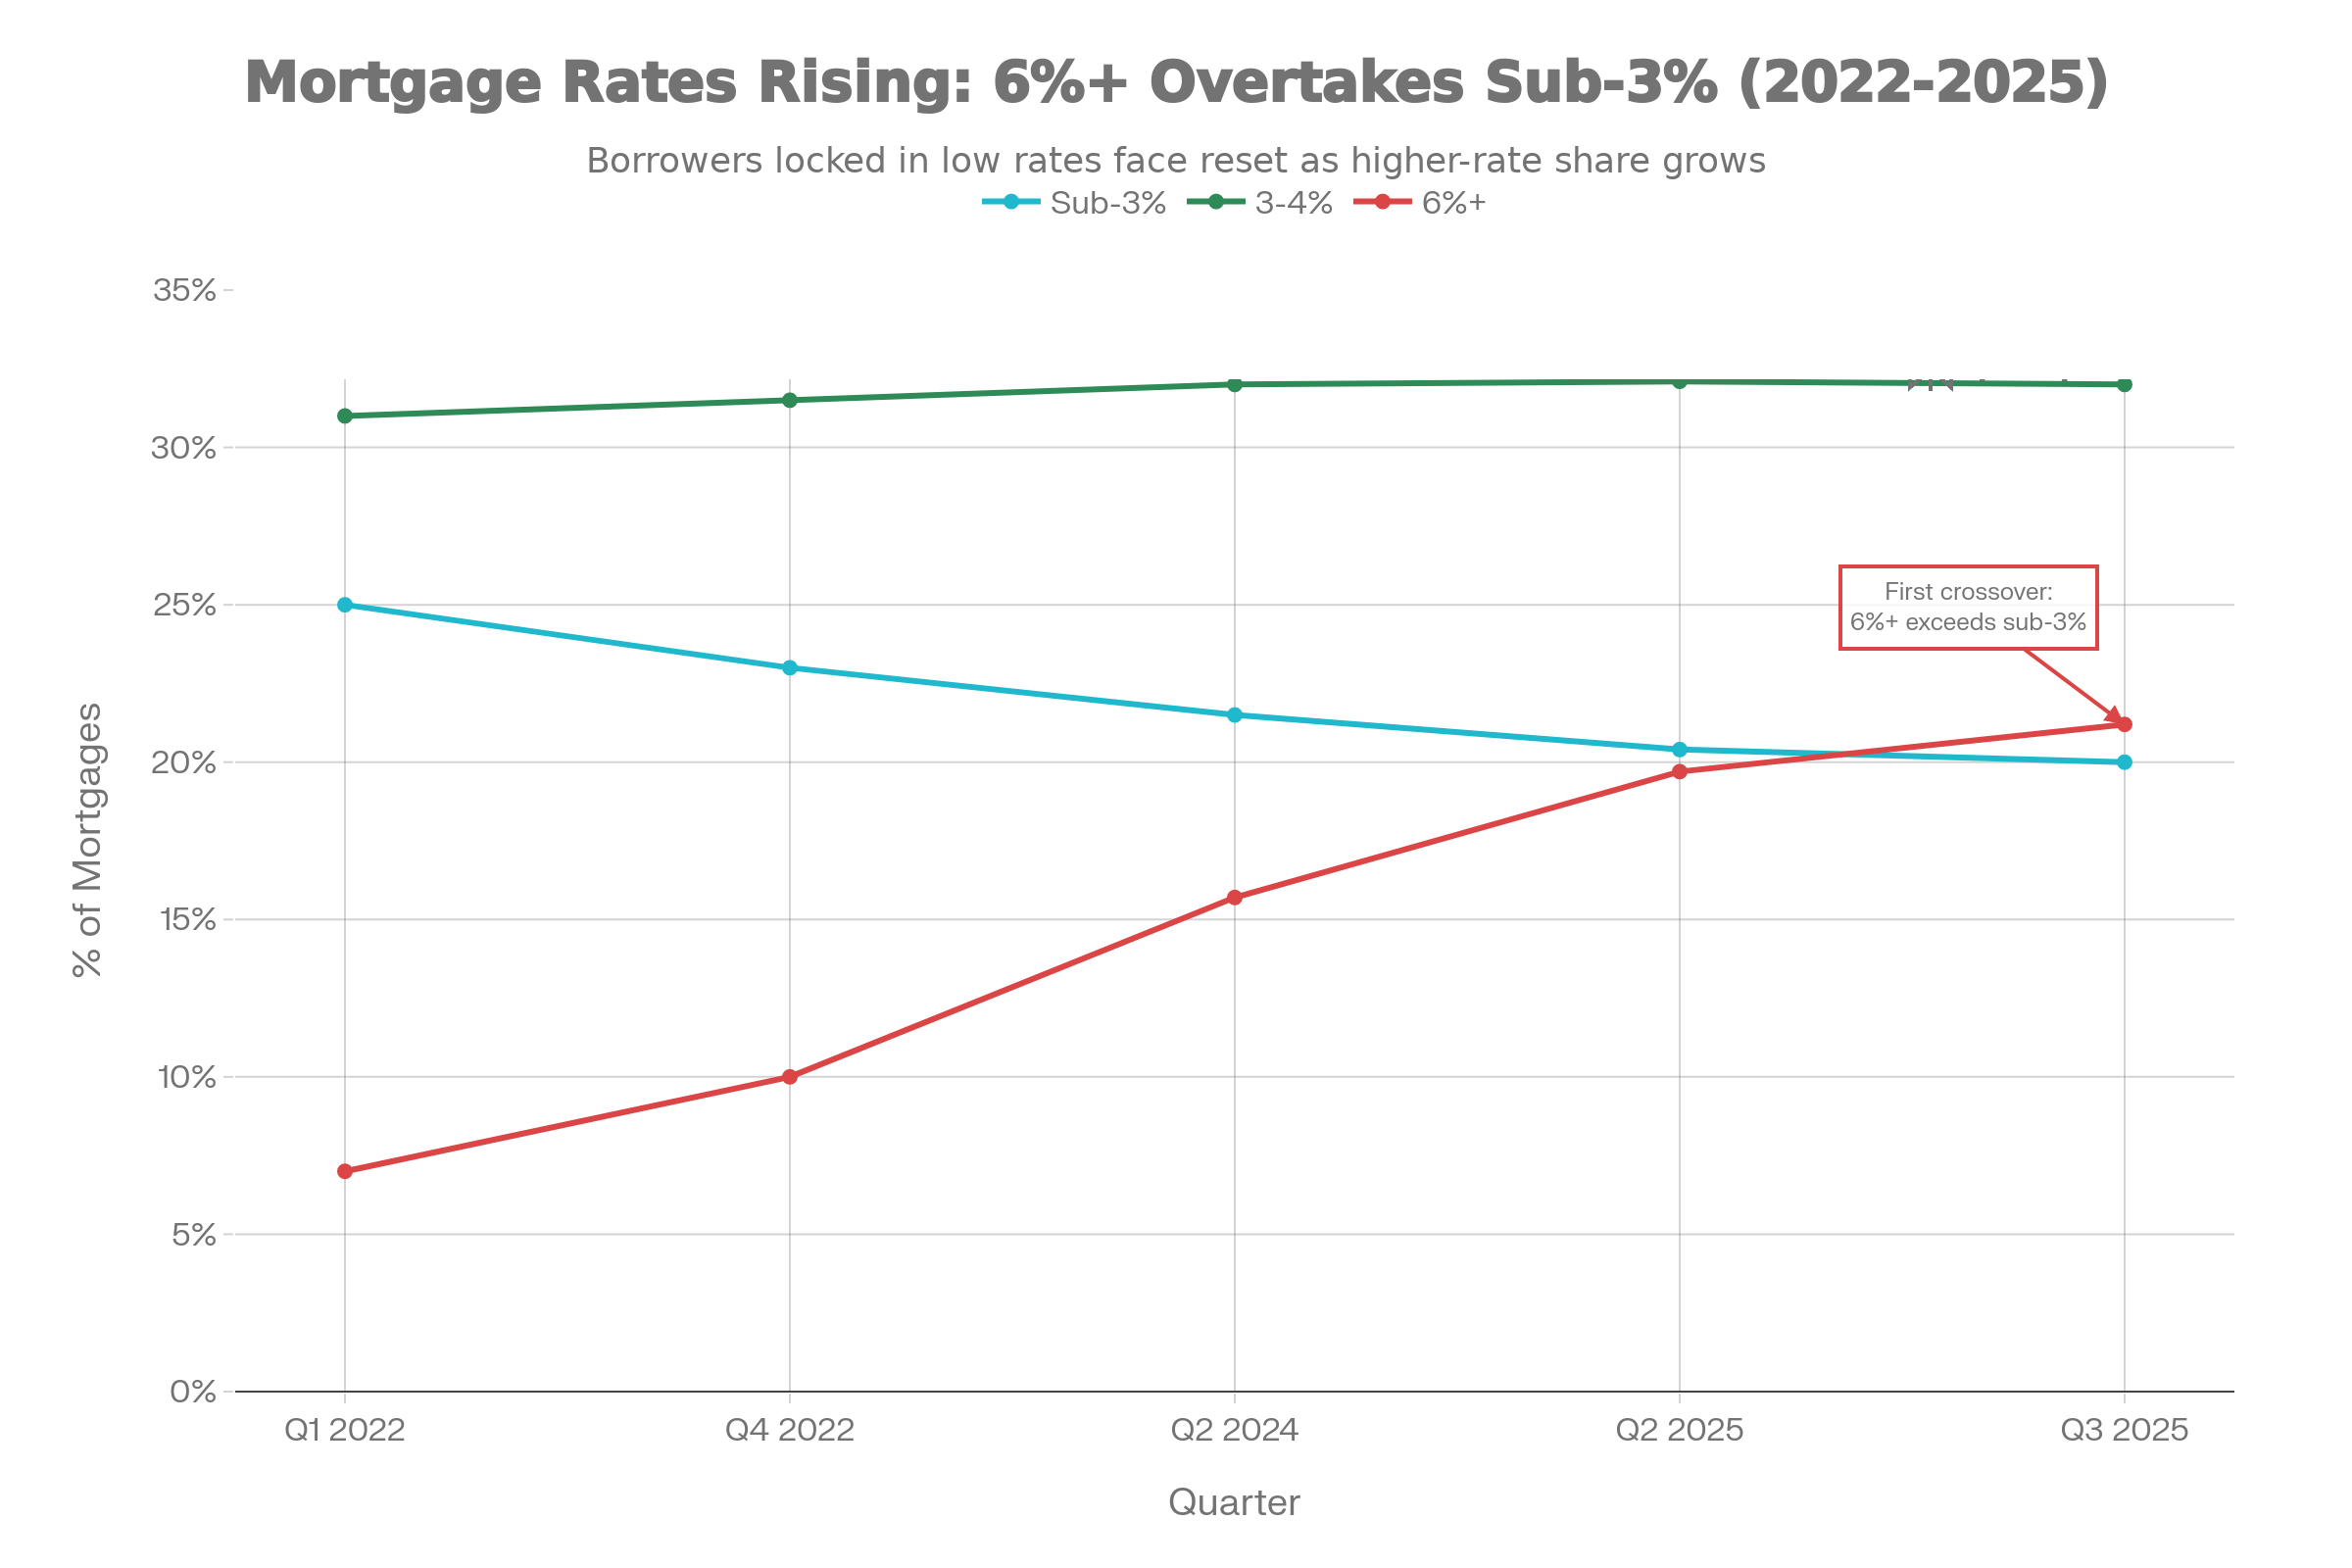
The data tells a compelling story: In the third quarter of 2025, for the first time since the Federal Reserve began its tightening cycle, the share of outstanding mortgages with rates above 6% (21.2%) surpassed those with rates below 3% (20.0%). This historic crossover marks more than a statistical milestone - it signals the beginning of the end for one of the most powerful forces constraining housing supply in modern American history.
This comprehensive analysis examines the multifaceted dynamics driving this transformation, drawing on authoritative data from the National Association of REALTORS®, Federal Housing Finance Agency, U.S. Census Bureau, ICE Mortgage Technology, and real-time market sentiment from Google Trends and social platforms. With over 50 data sources analyzed and five years of historical trends examined, we provide institutional-grade insights into what the Great Housing Reset means for every stakeholder in the residential real estate ecosystem.
Key Findings
- Outstanding mortgages with rates of 6% or higher have increased by 4 percentage points year-over-year and now represent the largest rate segment.
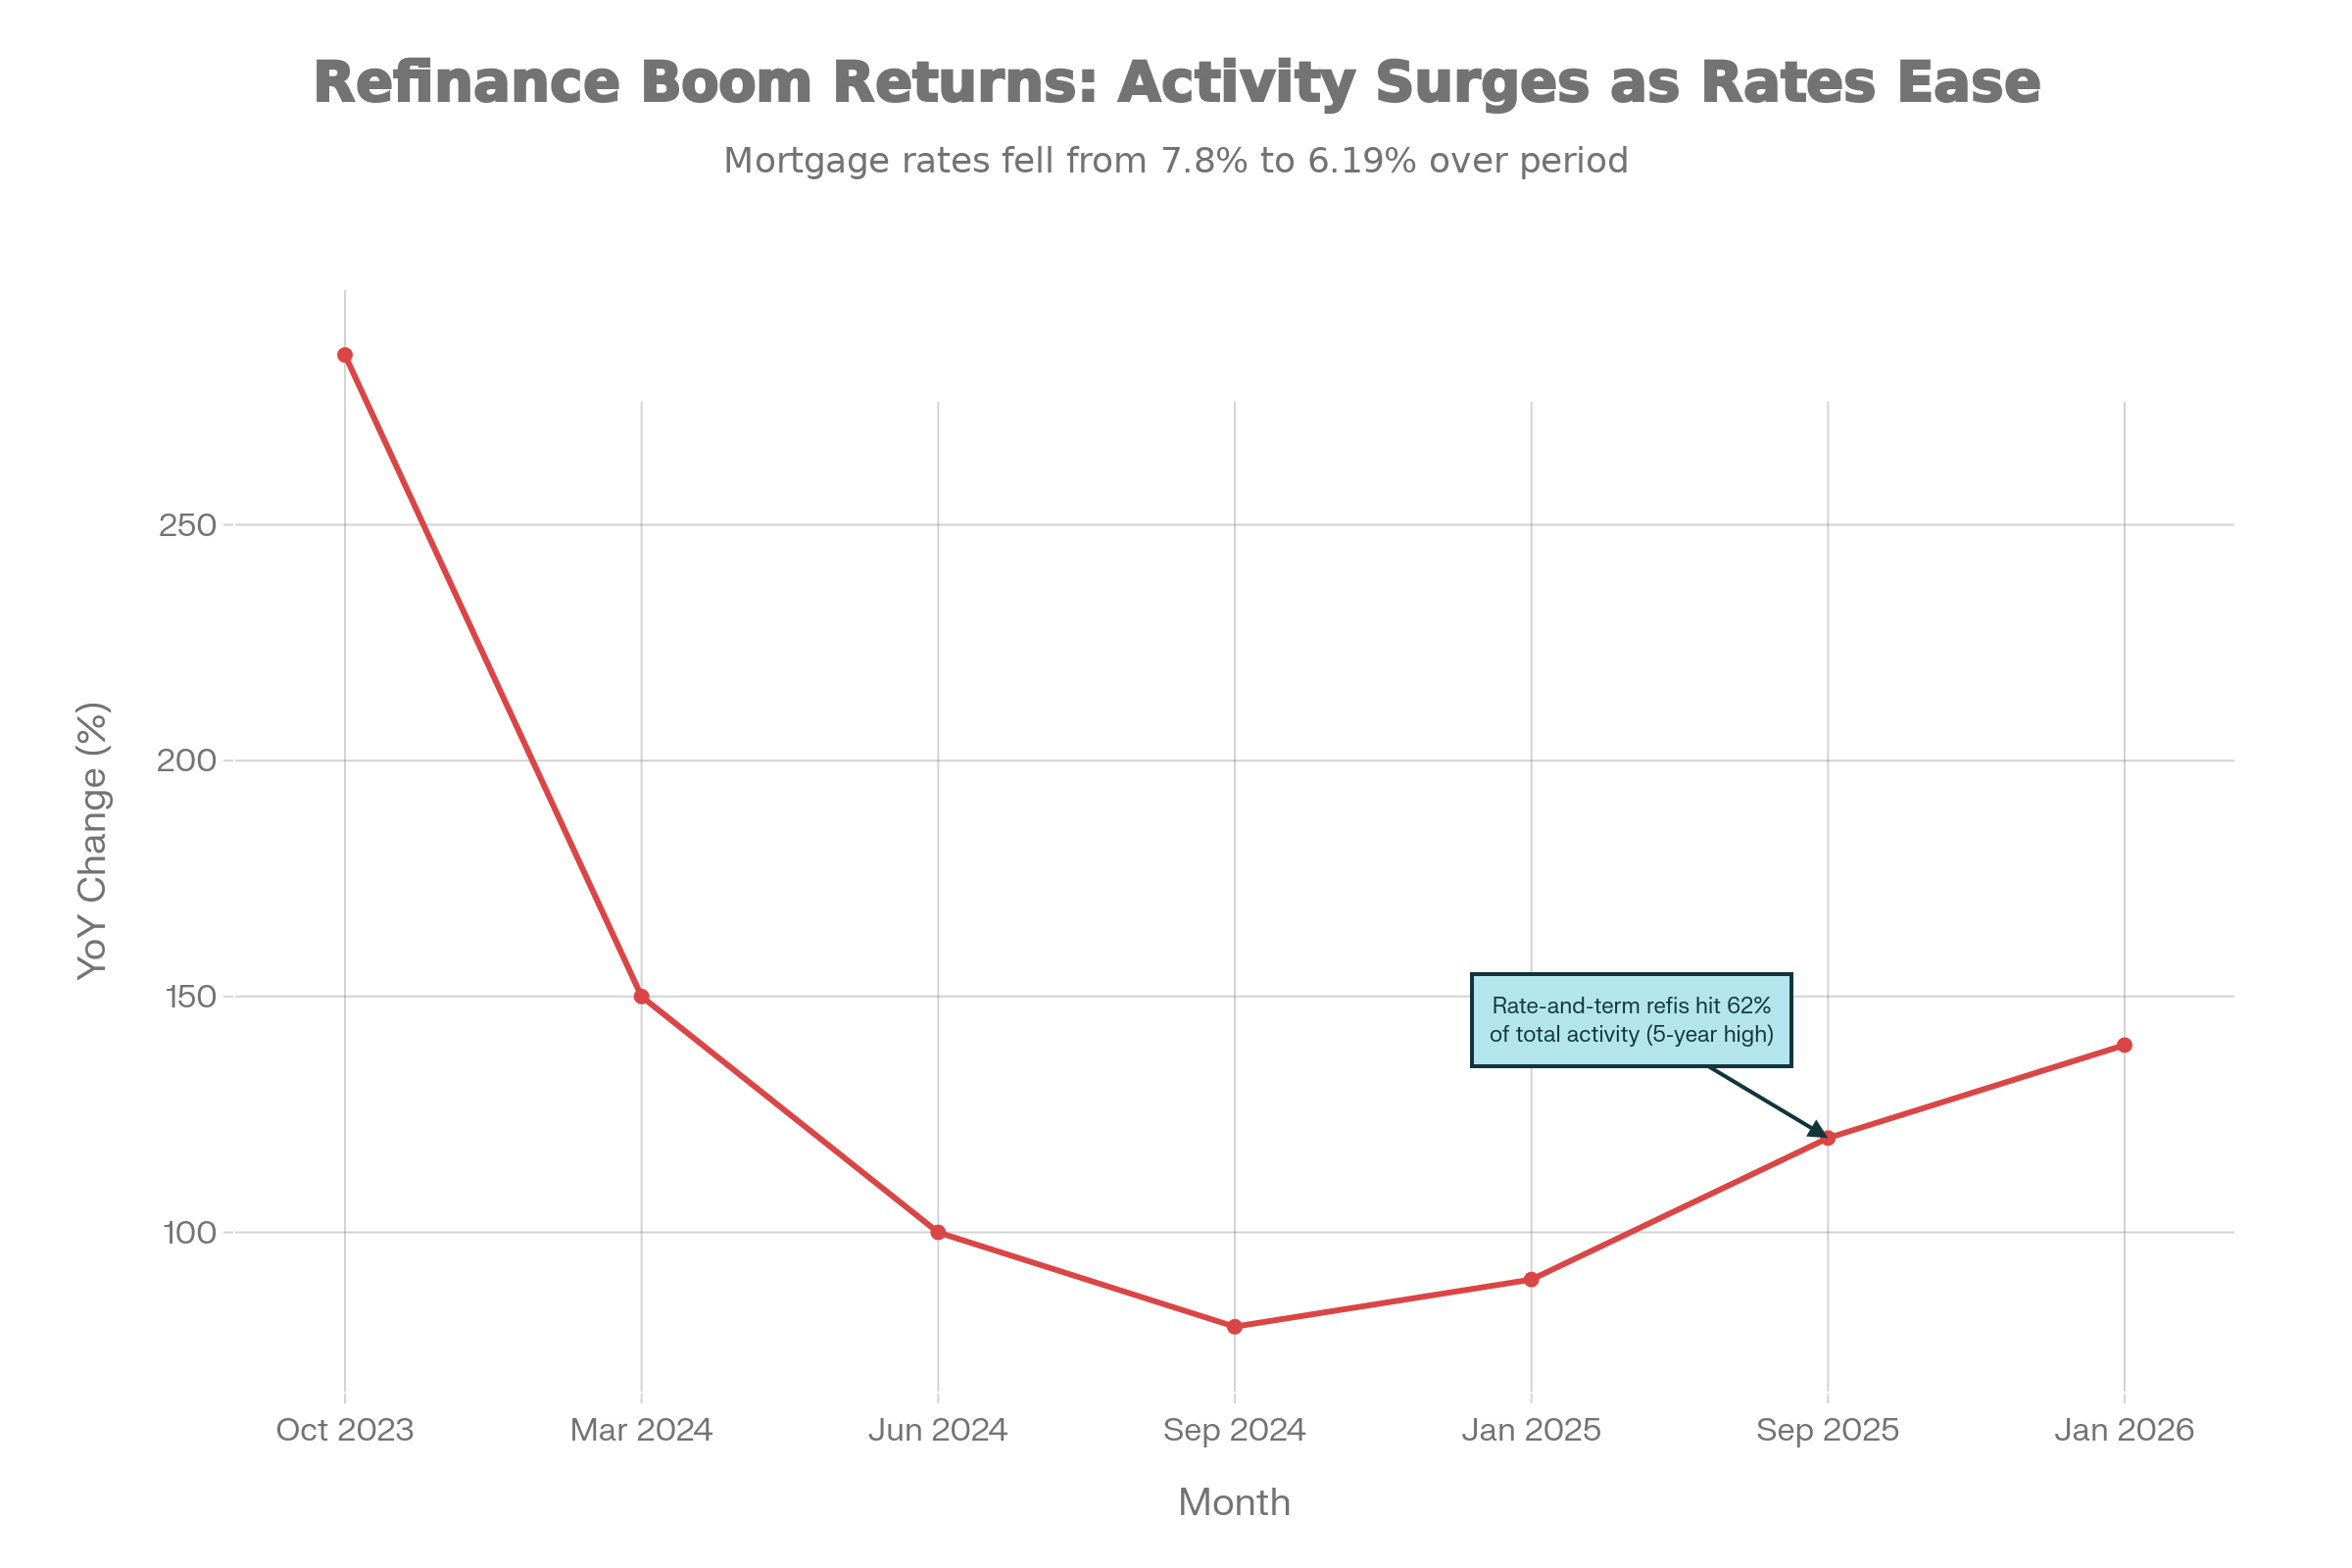
- Refinance applications surged 139.7% year-over-year as of January 2026, with rate-and-term refinances comprising 62% of activity - the highest share in five years.
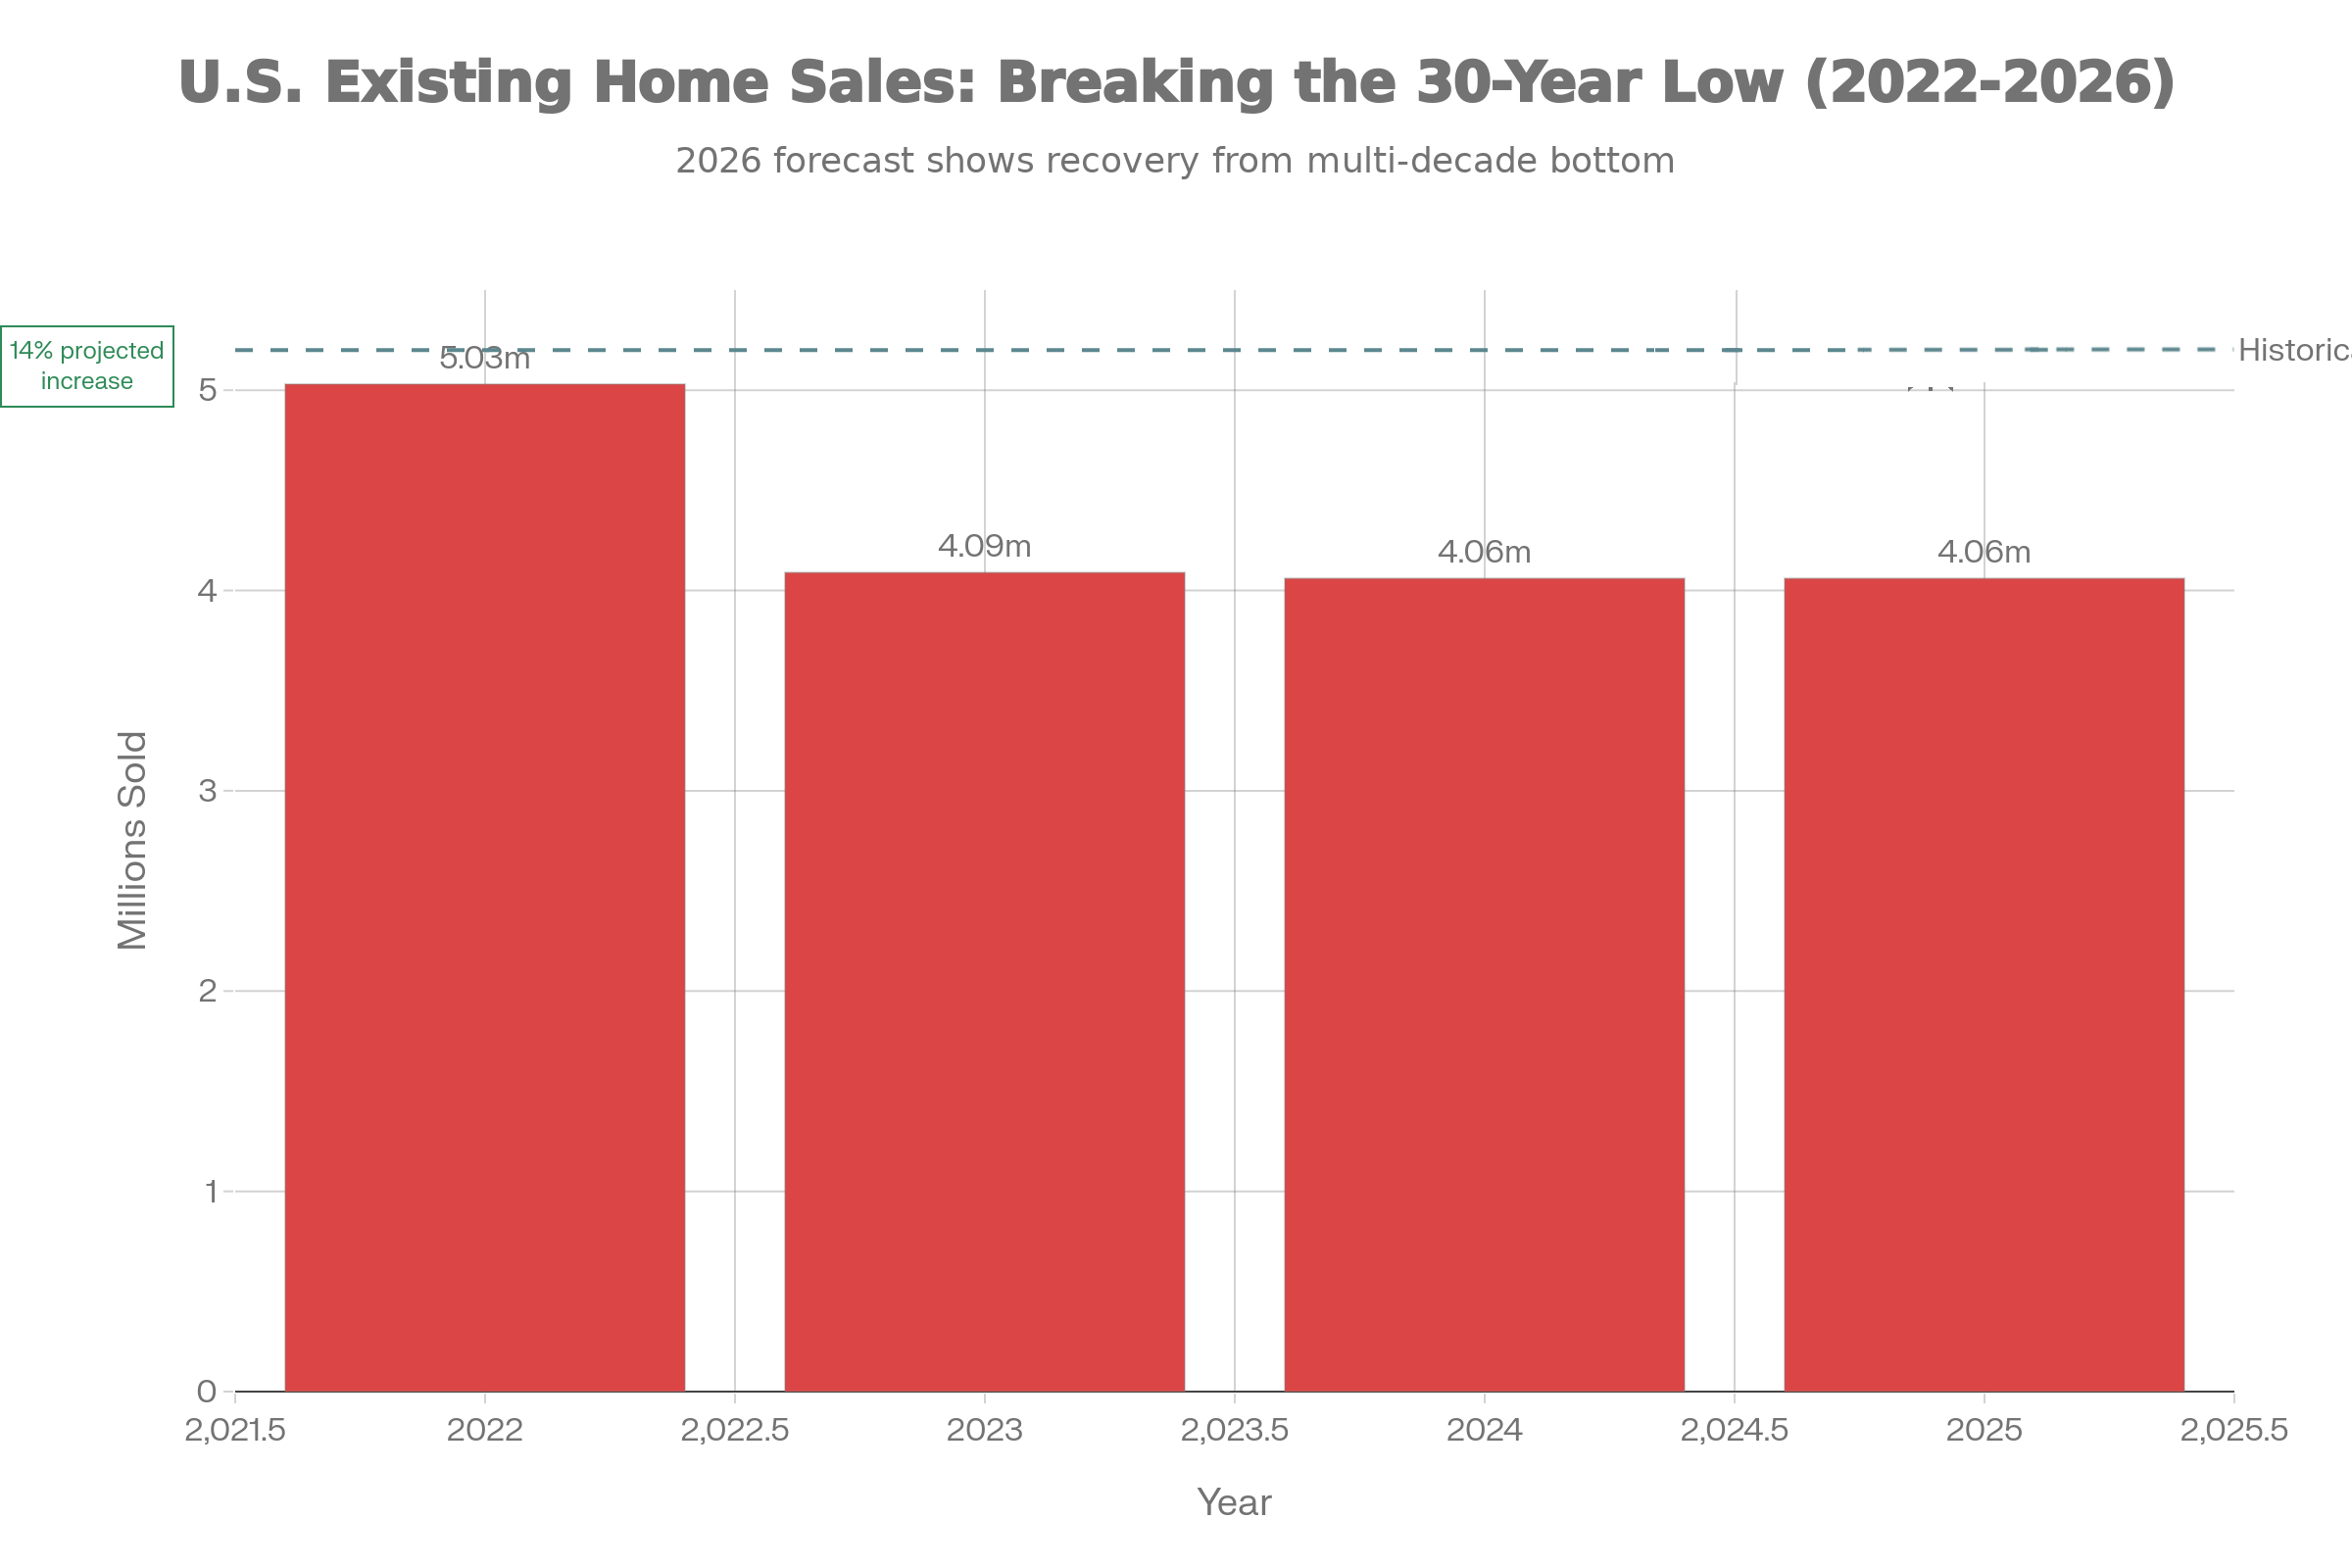
- Home sales are projected to jump 14% in 2026 after three consecutive years at 30-year lows.
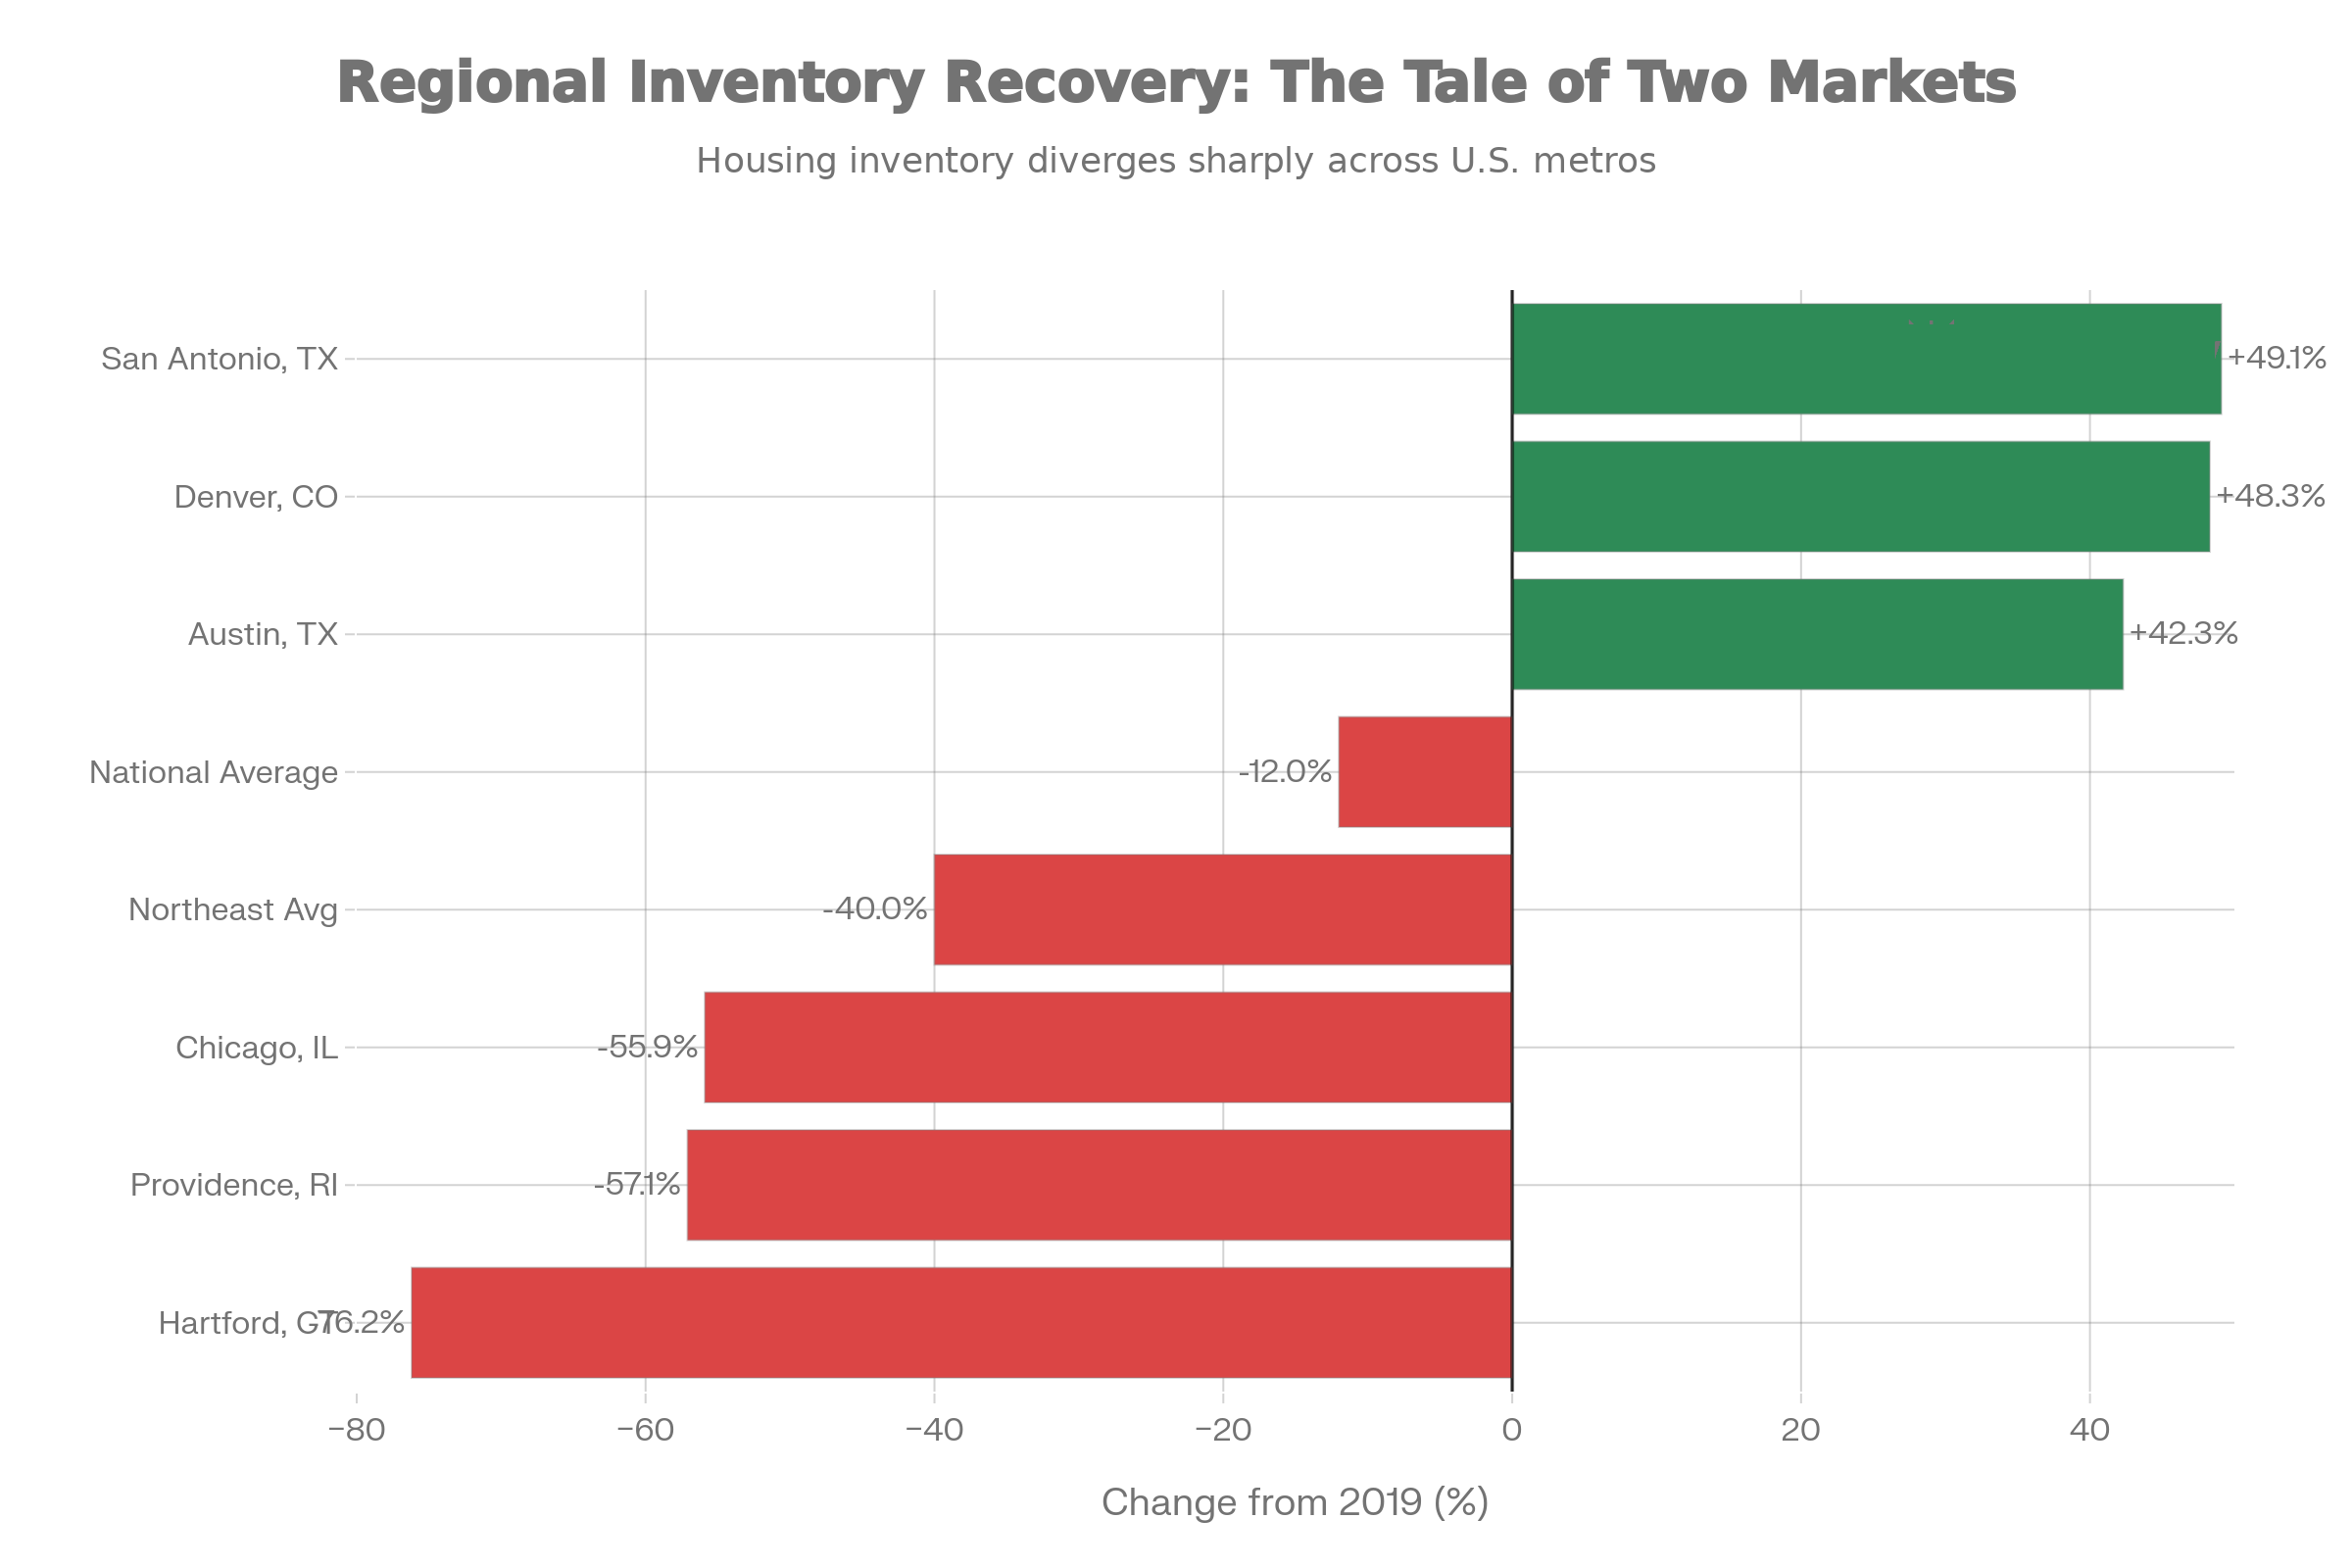
- Regional inventory disparities persist, with Sun Belt markets 42-49% above pre-pandemic levels while Northeast markets lag 40-76% behind.
- Homeowners hold a record $11.5 trillion in tappable equity, driving a 22% year-over-year increase in HELOC originations.
PART 1: THE SHIFT
Understanding the Mortgage Lock-In Effect: A Historical Context
The mortgage lock-in effect represents one of the most economically significant phenomena to emerge from the COVID-19 pandemic and subsequent Federal Reserve policy response. To understand its magnitude, we must first examine the extraordinary conditions that created it.
The Pandemic Rate Environment: An Unprecedented Anomaly
Between July 2020 and September 2021, the average 30-year fixed mortgage rate fell below 3% - the only period in the Federal Housing Finance Agency's data history (dating to 1971) where rates breached this threshold. During this 15-month window, millions of American homeowners locked in rates that, in historical context, represented a once-in-a-generation opportunity.
The numbers are staggering: By the first quarter of 2022, approximately 25% of all outstanding mortgages carried rates below 3%, and a combined 65.1% had rates at or below 4%. For homeowners fortunate enough to purchase or refinance during this period, monthly principal and interest payments on a $400,000 loan at 2.75% amounted to approximately $1,633. Fast forward to 2024, and the same loan amount at 7% would cost $2,661 per month - a $1,028 monthly premium, or more than $12,000 annually.
The Rapid Rate Reversal and Market Paralysis
The Federal Reserve's aggressive monetary tightening campaign, initiated in March 2022, sent mortgage rates from sub-3% to over 7% in less than 18 months - the fastest rate increase in four decades. This rapid reversal created an unprecedented asymmetry in the housing market: existing homeowners enjoyed extraordinarily low financing costs while prospective buyers faced dramatically higher borrowing expenses.
Academic research quantified the impact. Economists estimated the lock-in effect reduced nationwide home sales by more than one million transactions annually and boosted home prices by roughly 5-6% above where they otherwise would have been. The Philadelphia Federal Reserve published analysis showing mortgage lock-in reduced moving rates by 16% from 2022 to 2024.
The behavioral economics were straightforward: Why would a homeowner with a 2.9% mortgage rate voluntarily trade it for a 7% rate, effectively doubling their interest expense? The answer, for most households, was simple: they wouldn't. Home turnover rates plummeted to multi-decade lows, inventory dried up, and the market entered a prolonged state of low-volume, high-price equilibrium that persisted through 2025.
Consumer Sentiment: The Psychological Barrier
Survey data from 2025 revealed the depth of homeowner reluctance. A Bankrate study found that 54% of U.S. homeowners stated they would not be comfortable selling their home at any mortgage rate in 2025 - a 12-point increase from the previous year. Among homeowners with rates below 3%, an astounding 41% said they would not contemplate buying again at any rate.
The Crossover Point: Q3 2025 Marks a Historic Shift
The third quarter of 2025 will be remembered as a pivotal moment in housing market history. For the first time since the Federal Reserve began raising rates in 2022, the share of outstanding mortgages with interest rates of 6% or higher (21.2%) exceeded the share with rates below 3% (20.0%). This seemingly technical data point represents a profound structural transformation with far-reaching implications.
Deconstructing the Data
To appreciate the significance of this crossover, consider the underlying dynamics. The mortgage rate distribution across the U.S. housing stock represents a powerful indicator of market lock-in severity. When ultra-low-rate mortgages dominate the landscape, homeowners have maximum incentive to stay put. As the distribution shifts toward higher rates, that incentive diminishes - particularly for recent buyers who never enjoyed the pandemic-era rate environment.
| Quarter | Mortgages < 3% | Mortgages 3-4% | Mortgages 4-5% | Mortgages 5-6% | Mortgages ≥ 6% |
|---|---|---|---|---|---|
| Q1 2022 | 25.0% | 31.0% | 18.0% | 11.0% | 7.0% |
| Q4 2022 | 23.5% | 31.5% | 18.0% | 10.5% | 10.0% |
| Q2 2024 | 21.5% | 32.0% | 18.0% | 10.0% | 15.7% |
| Q2 2025 | 20.4% | 32.1% | 17.9% | 9.9% | 19.7% |
| Q3 2025 | 20.0% | 32.0% | 17.8% | 9.0% | 21.2% |
The table reveals several critical trends. First, the erosion of sub-3% mortgages has been relatively gradual - dropping just 5 percentage points over 3.5 years. This slow decay reflects the durability of the lock-in effect; homeowners with the lowest rates have been the most reluctant to move.
Second, the 3-4% bracket has remained remarkably stable at approximately 32%, representing the largest single cohort of mortgage holders. These homeowners - who refinanced or purchased in 2021 when rates ranged from 3-4% - also face significant lock-in incentives, though less severe than those with sub-3% rates.
Third, and most importantly, the 6%+ category has grown consistently and dramatically, from just 7% in early 2022 to 21.2% by Q3 2025 - a tripling in share. This growth stems from two sources: new purchase mortgages originated at current elevated rates, and refinances by homeowners with 2023-2024 vintage loans seeking to capture recent rate improvements.
Market Insight
Nick Gerli, founder of Reventure, noted in January 2026: "The share of borrowers with rates over 6% has reached a level not observed since 2015. Even in the current challenging climate, between 5 million and 6 million Americans secure new mortgages each year at elevated rates".
The "Swapper" Phenomenon: A Leading Indicator
Real estate analysts have identified a critical subset of homeowners dubbed "swappers" - those who are voluntarily exchanging lower-rate mortgages for higher-rate ones as part of a home purchase. While this might seem economically irrational at first glance, it reflects several important realities:
- Life events don't wait for optimal interest rates: Household formation, job changes, family expansion, and other life circumstances force housing moves regardless of rate environments
- Wealth effects: Many homeowners who purchased in 2020-2021 have seen substantial home equity appreciation, providing financial flexibility to absorb higher rates
- Opportunity cost: After three years of waiting, many households have concluded that further delays carry their own costs - missed job opportunities, family strain, inadequate space
- Expectation recalibration: By 2025, many prospective movers accepted that rates were unlikely to return to pandemic-era lows anytime soon
The data on swappers is revealing. Between Q2 2024 and Q2 2025, the share of mortgages at 6% or higher increased by 4 percentage points, even as overall home sales remained at 30-year lows. This suggests that a meaningful portion of the limited transaction volume consisted of buyers accepting higher rates rather than continuing to wait.
Nick Gerli, founder of Reventure, noted in January 2026: "The share of borrowers with rates over 6% has reached a level not observed since 2015. Even in the current challenging climate, between 5 million and 6 million Americans secure new mortgages each year at elevated rates". This ongoing origination activity, concentrated among first-time buyers and life-event-driven movers, is steadily diluting the concentration of ultra-low-rate mortgages in the market.
Regional Variations in the Crossover
Not all markets experienced the crossover simultaneously. Analysis by Realtor.com found that regions with higher rates of new construction and in-migration reached the tipping point earlier.
Markets where mortgages above 6% now significantly exceed sub-3% mortgages include:
- Sun Belt metros: Phoenix, Austin, Nashville, Charlotte, and Tampa led the way due to robust population growth and new construction. These markets saw substantial buyer activity throughout 2023-2025, even at elevated rates, driven by job growth and relative affordability compared to coastal markets.
- Secondary growth markets: Boise, Spokane, Raleigh, and Salt Lake City similarly shifted early as in-migrants prioritized location over interest rate optimization.
Conversely, markets where sub-3% mortgages remain more prevalent include:
- Coastal California: San Francisco, Los Angeles, and San Diego metros have lower transaction volumes and higher shares of long-term homeowners who refinanced en masse during the pandemic boom.
- Northeast corridor: New York, Boston, and Hartford metro areas maintain higher concentrations of low-rate mortgages due to lower inventory turnover and demographic patterns favoring aging-in-place.
These regional variations create differentiated investment and opportunity landscapes, which we'll explore in subsequent sections.
The Refinance Revival: Rate Relief Drives Record Activity
As mortgage rates eased from their 2024 peaks, dormant refinance activity roared back to life. The data reveals one of the most dramatic year-over-year surges in refinance volume since the pandemic-era refi boom, signaling that even marginal rate improvements can unlock significant pent-up demand.
By the Numbers: The Refinance Surge
- Volume Growth: As of the week ending January 9, 2026, the dollar volume of refinance applications increased 91.2% week-over-week and stood 139.7% higher than the same week in 2025.
- Share of Activity: Rate-and-term refinances - where borrowers seek to reduce their interest rate without extracting equity - accounted for 62% of all refinance activity in October 2025, the highest share in nearly five years.
- Retention Rates: Mortgage servicer retention of refinancing borrowers reached a 3.5-year high of 28% in Q3 2025.
- Target Population: Approximately 95% of rate-and-term refinances involved mortgages originated between 2023 and 2025.
Who's Refinancing and Why
The profile of the typical 2025-2026 refinancer differs markedly from the pandemic-era cohort:
2020-2021 Pandemic Refinancers: These borrowers typically refinanced from rates in the 4-5% range down to 2.5-3.5%, generating savings of $300-500/month on typical loan amounts. Many were repeat refinancers who had previously refinanced multiple times as rates cascaded lower. The motivation was purely opportunistic - capturing free money with minimal life disruption.
2025-2026 Recent-Vintage Refinancers: This cohort consists primarily of borrowers who purchased or refinanced in 2023-2024 at rates of 7-8%. They're refinancing down to 6-6.5%, generating savings of approximately $200/month on typical loan amounts. The motivation is part opportunistic and part corrective - many feel they "overpaid" on interest in 2023-2024 and view even modest rate relief as meaningful.
According to ICE Mortgage Technology , the average refinancer in late 2025 carried a loan balance of approximately $505,000 and had a credit score around 762. They achieved an average interest rate reduction of 0.92 percentage points, translating to roughly $200 in monthly savings. While this is roughly half the savings achieved during the 2020-2021 refi boom, it still represents $2,400 annually - enough to justify the transaction costs and paperwork burden for many households.
The HELOC Alternative: Second-Lien Surge
Parallel to the rate-and-term refinance boom, homeowners with ultra-low first mortgages discovered another tool: second-lien home equity lines of credit (HELOCs). Rather than refinancing away a 2.9% mortgage, these homeowners could tap accumulated equity through a HELOC while preserving their advantageous first mortgage rate.
For example, for a homeowner with a $400,000 mortgage at 3% who needs $75,000 for renovations, the HELOC strategy (keeping the 3% loan and adding a 7.5% HELOC) saves approximately $846 per month compared to cash-out refinancing the whole amount at 6.5%. This explains why second-lien originations surged to near-2008 levels in 2025.
Home Sales: Breaking Free from 30-Year Lows
After three consecutive years mired at the lowest transaction volumes since 1995, the U.S. housing market showed tangible signs of revival in late 2025. December 2025 marked a milestone: existing home sales surged 5.1% month-over-month to a seasonally adjusted annual rate of 4.35 million units - the highest level in nearly three years.
The December 2025 Turning Point
December 2025 marked an important milestone: existing home sales surged 5.1% month-over-month to a seasonally adjusted annual rate of 4.35 million units - the highest level in nearly three years. The gain exceeded analyst expectations of just 2.2% and reflected broad-based improvement across all major regions:
- South: +6.9% month-over-month, +3.6% year-over-year
- West: +6.6% month-over-month, flat year-over-year
- Northeast: +2.0% month-over-month, down year-over-year
- Midwest: +2.0% month-over-month, flat year-over-year
The geographic pattern is instructive. The South and West - regions with relatively higher inventory levels and more homes priced within reach of median-income buyers - led the recovery. The Northeast and Midwest, still grappling with severe inventory shortages, lagged despite posting positive monthly gains.
For full-year 2025, existing home sales totaled 4.06 million - unchanged from 2024 and marking the third consecutive year at generational lows. To contextualize this figure, annual home sales averaged 5.2 million from 1968-2025, meaning 2023-2025 transaction volumes ran roughly 22% below the long-term norm.
The 2026 Outlook: NAR's Bullish Forecast
The National Association of REALTORS®, in its December 2025 Forecast Summit, projected existing home sales will jump 14% in 2026 to approximately 4.63 million units. If realized, this would represent the largest single-year percentage gain since the post-financial crisis recovery period of 2009-2010.
NAR Chief Economist Lawrence Yun articulated the case for optimism: "After three years of flat home sales, a solid double-digit percentage increase is expected in 2026. We expect higher inventory, modest improvements in affordability, and more accommodating monetary policy from the Federal Reserve will help more Americans buy their next home".
The forecast rests on several key assumptions:
- Mortgage rates averaging 6.3% through 2026, down from roughly 6.8% in early 2025
- Active listing inventory rising 8.9%, marking a third consecutive year of inventory gains
- Home price appreciation moderating to 2.2%, improving affordability at the margin
- Labor market remaining stable with approximately 1.3 million new jobs
Independent forecasters largely align with NAR's directional outlook, though with varying degrees of optimism on magnitude. Realtor.com projects a more conservative 1.7% sales increase to 4.13 million units, while marketplace participants and regional analysts generally expect growth in the 5-12% range depending on local market conditions.
What's Driving the Recovery?
Several structural factors support the case for a 2026 sales rebound:
- Demographic Demand: Millennial household formation continues apace, with the largest generation in U.S. history moving through their peak homebuying years. The median age of first-time buyers reached a record 40 in 2025, suggesting pent-up demand from delayed household formation finally manifesting in purchase activity.
- Lock-In Erosion: As documented earlier, the growing share of mortgages above 6% means more homeowners face less acute rate differential pain when contemplating a move. A homeowner with a 6.5% mortgage who needs to move confronts a potential move to 6.3% - a minimal penalty compared to the 2.9%-to-6.8% scenario that paralyzed the market in 2023-2024.
- Psychological Threshold: Consumer surveys consistently identify 6% as a psychological benchmark. Bankrate found that 40% of potential buyers would find home purchase feasible if rates dropped below 6%, and 32% would participate if rates fell below 5%. As rates approach or breach these thresholds, buyer psychology shifts from "impossible" to "challenging but doable."
- Inventory Normalization: While still below pre-pandemic levels nationally, inventory has grown for three consecutive years. This creates a self-reinforcing dynamic: more inventory reduces competition and bidding wars, improving buyer confidence; improved buyer confidence draws marginal buyers off the sidelines; increased buyer activity gives sellers confidence to list; and the cycle continues.
- Life Can't Wait Forever: Perhaps most importantly, after three years of deferral, many households have simply run out of patience. The family that outgrew their two-bedroom condo in 2022 can't wait any longer. The couple experiencing divorce can't continue cohabitating indefinitely. The retiree wanting to downsize has delayed long enough. These forced transactions, combined with discretionary movers who've recalibrated expectations, will provide the base for 2026's anticipated volume increase.
Risks to the Forecast
The 14% increase forecast is hardly guaranteed. Several factors could derail or diminish the recovery:
- Interest rate volatility: The NAR projection assumes mortgage rates averaging 6.3%. If rates remain stubbornly elevated at 7% or above - possible if inflation proves stickier than expected or if Treasury yields rise due to fiscal concerns - buyer demand could remain suppressed.
- Economic recession: A material downturn in employment would overwhelm any affordability gains from rate declines. Job losses historically trigger housing market weakness, both by reducing buyer capacity and by forcing distressed sales.
- Price stickiness: If sellers refuse to adjust asking prices to match the current rate environment, transaction volume may remain depressed. This was evident in multiple markets throughout 2024-2025, where sellers with unrealistic price expectations pulled listings rather than accept market bids.
- Regional divergence: National figures mask dramatic local variation. Markets with ample inventory and affordability (many Sun Belt metros) may see 20-30% sales increases, while supply-constrained coastal markets may remain flat or even decline.
Despite these risks, the preponderance of evidence suggests 2026 will mark a meaningful improvement over the 2023-2025 trough. Whether the increase reaches 14% or proves more modest, the directional momentum appears clear.
Regional Divergence: Two Americas in the Housing Market
One of the most striking features of the 2026 housing market is the widening gulf between regional outcomes. National statistics obscure radically different trajectories across regions.
The Tale of Two Inventory Stories
Housing inventory - measured as active listings for sale-serves as perhaps the single best indicator of market health. Balanced markets typically maintain 4-6 months of supply at current sales rates, providing neither extreme scarcity that fuels bidding wars nor excessive supply that pressures prices downward.
The regional inventory picture as of December 2025 reveals extraordinary polarization:
Sun Belt Oversupply:
- Austin, TX: +91% vs. 2019, with prices down 2% year-over-year
- San Antonio, TX: +49.1% vs. pre-pandemic levels
- Denver, CO: +48.3% inventory recovery
- Phoenix, AZ: +15.6% vs. 2019
- Tampa, FL: +13.3%, though down 13.7% from peak seasonal levels
Northeast/Midwest Scarcity:
- Hartford, CT: -76.2% vs. 2019 levels
- Providence, RI: -57.1% below pre-pandemic
- Chicago, IL: -55.9% inventory deficit
- New York metro: -40% (representative of broader Northeast)
- National average: -12% vs. 2019
What explains these dramatic differences? The answer involves construction patterns, migration dynamics, and regulatory environments:
Construction Response: Sun Belt markets, blessed with available land and generally pro-development regulatory regimes, responded to the 2020-2021 demand surge by dramatically ramping homebuilding. Phoenix, for example, averaged 40,000+ annual housing permits in 2021-2023, compared to a pre-pandemic average of 25,000. When demand normalized post-2022, this construction pipeline continued flowing, creating the current oversupply condition.
Conversely, Northeast and Midwest markets face geographic and regulatory constraints that limit construction. Manhattan can't expand its footprint. San Francisco Bay Area NIMBY opposition blocks new development. These markets saw minimal construction increases despite surging demand, perpetuating scarcity even as national conditions normalized.
Migration Patterns: The Sun Belt absorbed massive net in-migration during the pandemic - roughly 2.685 million net domestic migrants to the South between 2020-2023. However, this migration wave peaked in 2021-2022 and has since moderated significantly. Markets that built in anticipation of sustained in-migration now face oversupply as the influx slows.
The Northeast and Midwest, which experienced net out-migration during the pandemic, never built speculatively. Lower construction combined with slowing out-migration (and in some cases, modest return migration) has kept these markets tight.
Institutional Activity: Some Sun Belt markets saw concentrated institutional investor purchases in 2020-2022, adding to demand. As these investors pulled back in 2023-2025, demand declined even as new supply continued hitting the market, exacerbating oversupply.
Price Performance: The Inevitable Consequence
Inventory conditions drive price outcomes. Markets with surplus inventory face price pressure; those with scarcity see continued appreciation. The data confirms this relationship:
Price Performance by Region (Year-over-Year, December 2025):
| Region | Median Price | YoY Change | Price/Sq Ft Change | Inventory Status |
|---|---|---|---|---|
| Northeast | $450,000 | +2.0% | +4.1% | Severe shortage |
| Midwest | $306,000 | +3.1% | +1.7% | Moderate shortage |
| South | $360,200 | -0.3% | Flat to negative | Oversupply in many metros |
| West | $605,600 | -1.4% | -2.0% to -3.5% | Mixed (CA oversupply, others balanced) |
| National | $405,400 | +0.4% | +1.2% | Moderate shortage |
The pattern is unmistakable: tight markets (Northeast, Midwest) continue appreciating despite overall market softness; loose markets (South, West) show flat-to-negative price growth.
Drilling down to specific metros reveals even starker contrasts:
Strongest Appreciation (Q1 2020 - Q3 2025):
- Knoxville, TN: +88.4%
- Atlantic City, NJ: +88.3%
- Savannah, GA: +82.1%
Weakest Appreciation:
- San Francisco-Oakland: +23.3%
- New Orleans: +21.8%
- Lake Charles, LA: +20.5%
Interestingly, many of the strongest-appreciating markets are small-to-mid-sized metros in the Southeast that avoided oversupply while benefiting from migration and remote work trends. The weakest markets include both Bay Area metros (where prices remain extraordinarily high despite modest percentage gains) and Louisiana markets affected by hurricane risk, insurance costs, and out-migration.
Investment Implications: Contrarian Opportunities
The regional divergence creates a complex opportunity landscape for investors and strategic buyers:
- Sun Belt Oversupply = Near-Term Challenges, Long-Term Opportunity: Markets like Austin, with 91% more inventory than 2019 and flat-to-negative price growth, may appear distressed. However, fundamentals tell a different story. Austin's population grew 2.4% in 2024 - three times the national average. Job growth remains robust, exceeding 1.3% annually. The current oversupply reflects a temporary imbalance between construction pipeline and current absorption rates, not a fundamental demand problem. For patient investors with 5-10 year horizons, these markets may offer the best risk-adjusted returns. Purchasing in markets with strong fundamentals during periods of temporary oversupply has historically generated superior returns relative to buying in perpetually constrained markets at peak prices.
- Northeast/Midwest Scarcity = Stability, Limited Upside: Markets with severe inventory deficits offer downside protection - prices are unlikely to fall meaningfully when supply is 50-75% below normal. However, affordability constraints limit upside. Boston, New York, and San Francisco face structural barriers to meaningful price appreciation given current income levels. For investors prioritizing stability and preservation of capital, these markets offer appeal. For those seeking aggressive appreciation, they're less attractive absent a catalyst that dramatically improves affordability (such as remote work driving wage convergence) or supply (unlikely given regulatory environments).
- Secondary Markets = Goldilocks Zone: Mid-sized metros like Charleston, Charlotte, Columbus, Raleigh, and Minneapolis represent a middle path. NAR identified these as top housing markets for 2026 due to balanced inventory recovery, strong job growth, millennial household formation, and improving affordability. These markets avoided the extremes of both Sun Belt overbuilding and coastal scarcity, positioning them for steady, sustainable growth.
Affordability: The Persistent Challenge
While the weakening lock-in effect and inventory recovery represent positive developments, they unfold against a backdrop of historically poor affordability. Understanding this constraint is essential to tempering expectations for the magnitude and character of the 2026 recovery.
Measuring the Affordability Crisis
Multiple metrics capture the affordability challenge:
Income Requirements: According to ATTOM Data Solutions , affording the nationwide median home price of $365,185 in Q4 2025 requires an annual income of $86,374 - assuming a 28% front-end debt-to-income ratio, 20% down payment, and including property taxes and insurance. This exceeds the national average wage of $77,038, rendering the typical home unaffordable for the average worker.
The gap is far worse in high-cost markets:
- California statewide: $221,000 annual income required for median home
- Los Angeles metro: $218,400 income needed
- San Francisco Bay Area: $359,200 income required for $1.4 million median
Only 15% of California households could afford the state's median-priced home in Q2 2025, compared to 56% at the 2012 affordability peak. Nationally, 34% of households can afford the median home - down from pre-pandemic levels of 40-45%.
Housing Affordability Index: The National Association of REALTORS® publishes a composite affordability index where 100 represents the income level at which a median-income family can afford a median-priced home. Values above 100 indicate affordability; below 100 indicates unaffordability. As of October 2025, the index stood at approximately 102 - barely affordable. For comparison, the index averaged 130-140 from 2010-2019.
Mortgage Payment to Rent Ratio: Historically, monthly ownership costs (mortgage, taxes, insurance) have tracked close to rental costs, with ownership typically 0-10% more expensive to account for maintenance and opportunity cost of down payment capital. In 2025, however, homeownership costs ran approximately 40% higher than comparable rental costs in many markets. This unprecedented gap reflects the rapid rate rise that increased monthly mortgage payments without corresponding rent increases.
Historical Context: Longterm housing analysts note that pre-pandemic affordability conditions may not return until 2047 according to some projections. This sobering assessment suggests that even with rate moderation and inventory improvement, affordability will remain structurally challenged absent either dramatic income growth or significant home price deflation (which would create its own economic challenges).
Who's Been Locked Out?
The affordability crisis has disproportionately impacted specific demographic cohorts:
First-Time Buyers: The first-time buyer share of the market fell to a historic low of 21% in 2025, down from a typical 35-40% in healthier markets. The median age of first-time buyers reached 40 - up from 32-34 in the 2010-2015 period. This reflects the extraordinary challenge of accumulating sufficient down payment capital while simultaneously facing elevated mortgage rates and high prices.
Millennials and Gen Z: Despite representing the largest demographic cohorts entering prime homebuying years, younger Americans face the worst affordability environment in generations. The typical millennial household has less wealth than comparable-age households had in previous decades, largely due to student debt, delayed career formation, and missing out on the home price appreciation of the 2010s.
Interestingly, survey data shows Gen Z remains undeterred. A remarkable 67% of Gen Z respondents indicated plans to purchase homes in 2026 - higher than millennials (51%), Gen X (49%), or baby boomers (22%). However, their strategies differ: 63% of Gen Z buyers express willingness to purchase fixer-uppers, and they're targeting secondary markets where prices remain more accessible.
Middle-Income Workers: Perhaps most concerning, middle-income workers - traditionally the core of American homeownership - find themselves increasingly priced out. NAR economists noted that only 21% of middle-income buyers can afford the typical listing nationwide, down from 50% pre-pandemic. This "hollowing out" of the market, where high-income and investor buyers dominate while middle-income buyers disappear, threatens the social fabric of homeownership as a wealth-building tool for ordinary Americans.
The Starter Home Supply Crisis
Compounding the affordability challenge is a stark mismatch between available inventory and buyer needs. Only 9% of newly constructed homes in 2023 were under 1,400 square feet (the traditional "starter home" size), down from 40% in 1982. Builders, facing high land and construction costs, find it economically more attractive to build larger, higher-margin homes rather than affordable entry-level units.
The result is a structural shortage of 3-4 million housing units nationwide, concentrated in the affordable/starter segment. This mismatch means that even as overall inventory improves, the specific types of homes first-time and moderate-income buyers need remain scarce, perpetuating affordability challenges independent of interest rate movements.
Affordability Solutions and Mitigants
Several trends and policy proposals aim to address the affordability crisis:
- Build-to-Rent Communities: Purpose-built single-family rental communities delivered 39,000 homes in 2024, a 455% increase from 2019, with 90,000+ units in the pipeline. While these don't create homeownership opportunities, they provide an alternative for households priced out of ownership, potentially alleviating some demand pressure on for-sale inventory.
- Accessory Dwelling Units (ADUs): Many jurisdictions have relaxed zoning to allow ADUs (garage conversions, backyard cottages, basement apartments). While modest in scale, these units add rental supply at relatively low cost, potentially helping moderate rent growth and allowing some renters to save for down payments.
- Down Payment Assistance: Various federal, state, and local programs offer down payment assistance grants or loans to first-time buyers. While helpful for individual recipients, these programs are typically too small in scale to meaningfully move market-level affordability.
- Extended Mortgage Terms: The Trump administration has explored offering 50-year mortgages to reduce monthly payments. Critics note this would dramatically increase lifetime interest costs and push first-time buyers even deeper into debt, potentially creating future financial stability risks.
- Interest Rate Buydowns: Homebuilders increasingly offer interest rate buydowns (temporary or permanent rate reductions funded by builder concessions) to make new homes more affordable. This strategy helps clear inventory but doesn't address systemic affordability challenges.
Ultimately, sustainable affordability improvement requires either: (1) substantial income growth outpacing home price growth, (2) home price moderation or decline, or (3) interest rate normalization to 4-5% ranges. The first seems unlikely in the near term; the second would create economic disruptions and financial stability concerns; the third depends on inflation trends and Federal Reserve policy outside housing market control.
Google Trends and Social Sentiment: The Digital Pulse of the Market
Beyond official statistics, analyzing Google search behavior and social media discourse provides real-time insight into consumer sentiment and market momentum. The data reveals a market psychology in transition - from resignation and paralysis toward cautious engagement and measured optimism.
Google Trends: The Leading Indicator
Google Trends data, which tracks relative search volume for specific queries over time, serves as a powerful forward indicator of market activity. Research consistently shows that online search patterns predict actual purchase behavior by 30-90 days, as buyers progress from initial curiosity through education to transaction readiness.
Key findings from 2025 Google Trends analysis:
- July 2025 Search Peak: Searches for "homes for sale" and "houses for sale" reached a two-year high in July 2025. This surge occurred before mortgage rates declined meaningfully, suggesting buyer interest was building even when financing conditions remained challenging. The implication: substantial pent-up demand existed, waiting for even modest rate relief to translate into action.
- Search-to-Application Correlation: The timing between the July search surge and the September-October refinance/purchase application surge (~8-12 weeks) aligns perfectly with typical buyer timelines. Prospective buyers begin with general searches, progress to specific property browsing, and ultimately submit applications. The correlation validates Google Trends as a predictive tool.
- Southern California Specifics: Detailed analysis of Southern California search patterns showed upticks in Inland Empire, Orange County, and San Diego markets despite high prices. Search volume peaked during weekday evenings (8-10 PM) and Sunday afternoons - periods when serious buyers research after work or during weekend "open house browsing" times. This behavioral pattern indicates genuine purchase intent rather than casual curiosity.
Question-Based Searches
Analysis of most-googled real estate questions in 2025 revealed dominant themes:
- "What will the housing market look like in 2026?"
- "How do interest rates affect home prices?"
- "Is now a good time to buy a house?"
- "Will the housing market crash?"
- "How much do I need for a down payment?"
The prevalence of timing questions ("will...in 2026," "is now a good time") reflects pervasive uncertainty and the strategic waiting game many buyers have played. The persistence of "will the market crash?" queries indicates lingering hope among prospective buyers for a dramatic correction that would improve affordability - a hope that, per the data, appears unlikely to materialize.
Reddit and Forum Sentiment: The Unfiltered View
Social media platforms, particularly Reddit's real estate communities, provide unfiltered insight into buyer, seller, and investor psychology. Analyzing sentiment across key subreddits ( r/RealEstate, r/FirstTimeHomeBuyer, r/REBubble dominant themes:
- Buyer Frustration and Fatigue: Posts throughout 2025 expressed profound frustration with the "affordability trap" - inability to buy due to high prices and rates, but also inability to wait indefinitely due to rising rents and life circumstances. A representative November 2025 post lamented: "Almost the end of 2025… still no house. Anyone else in the same boat? We've toured so many places this year… some had crazy asking prices, others needed major work".
- Seller Stubbornness: Buyers consistently reported encountering sellers with "delusional" pricing expectations. Multiple threads described sellers who purchased in 2020-2021 at elevated prices and now, facing the reality of a higher-rate environment, refuse to accept that their homes won't sell for the 2022 peak-market comps they're anchored to. This creates a standoff: buyers won't pay 2022 prices at 2025 rates; sellers won't "lose" by accepting lower prices. The result is extended days-on-market and withdrawn listings.
- Regional Market Peculiarities: A June 2025 thread titled "The LA real estate market in 2025 is weird right now" captured the confusing dynamics in high-cost coastal markets. The original poster noted: "Downtown LA is a mess. High vacancies, long days on market, and prices still went up 12% year-over-year? I don't get it." Responses explained that cash buyers and income-restricted buyers created dual markets - luxury and investment properties moved quickly at elevated prices, while middle-market homes languished.
- Investor Caution: Real estate investor forums (r/Realestatefinance, r/realestateinvesting) showed significant strategic disagreement. Some investors advocated waiting for "better conditions" (lower rates, price corrections), while others argued for "doubling down" on cash-flow properties in secondary markets where rental yields remained attractive despite high rates. The lack of consensus suggests uncertainty about market direction even among sophisticated participants.
- Expectation Recalibration: A subtle but important shift emerged in late 2025 sentiment: acceptance. Many buyers and sellers began acknowledging that rates were unlikely to return to 3% and that waiting indefinitely carried its own opportunity costs. This psychological shift from "waiting for perfect conditions" to "acting under current circumstances" likely contributed to the December 2025 sales surge.
Synthesis: What Search and Social Tell Us
Combining Google Trends and social sentiment analysis yields several insights:
- Pent-up demand is real and substantial: The July search surge and continued high search volumes despite challenging conditions demonstrate that many households remain interested in homeownership, even if not yet actively transacting.
- Psychological thresholds matter more than economic models: The 6% mortgage rate threshold, while economically arbitrary, holds tremendous psychological power. As rates approach or breach this level, consumer behavior shifts dramatically - more than would be predicted by pure affordability calculations.
- Price expectations remain misaligned: The persistent gap between seller expectations and buyer willingness to pay represents one of the key frictions preventing higher transaction volumes. This gap will only resolve through either price reductions or continued waiting until enough sellers capitulate or rates improve sufficiently to bridge the delta.
- Regional experiences vary wildly: National narratives obscure dramatic local differences. Coastal California, Sun Belt boomtowns, Midwest metros, and Northeast markets occupy almost entirely different realities. Generic advice or predictions will prove wrong for many markets even if correct nationally.
- Life events trump market timing: Ultimately, housing is a necessity, not a discretionary purchase like consumer electronics. The families who need to move for jobs, schools, family formation, or other life reasons will transact regardless of rate environments. This base level of "forced" transactions provides a floor for market activity even in challenging conditions.
The 2026 Outlook: Forecasts, Opportunities, and Risks
Synthesizing the mortgage rate evolution, inventory dynamics, affordability constraints, and sentiment indicators, we can now construct a data-driven outlook for 2026 and identify actionable opportunities for various market participants.
The Base Case: Moderate Recovery with Regional Variance
The most likely 2026 scenario involves modest national improvement characterized by:
- Sales Volume: 10-14% increase to 4.45-4.63 million transactions, consistent with NAR's forecast. This would still represent volumes 10-15% below pre-pandemic norms but a meaningful improvement from the 2023-2025 trough.
- Home Prices: National median price appreciation of 2-4%, concentrated in supply-constrained markets. Sun Belt oversupply markets may see flat-to-negative price movement while Northeast/Midwest tight markets appreciate 3-6%.
- Inventory: Continued recovery with active listings up 7-10%, bringing national supply to within 5-8% of pre-pandemic levels. Regional variation persists, with Sun Belt markets reaching or exceeding pre-pandemic norms while coastal markets remain 20-30% below historical averages.
- Mortgage Rates: Averaging 6.1-6.4% for 30-year fixed rates, down modestly from 2025's 6.6-6.8% average but well above pandemic-era lows. Rates will likely trade in a 5.9-6.8% range depending on inflation data and Federal Reserve policy signals.
- Affordability: Marginal improvement from 2025 due to modest rate declines and wage growth outpacing home price appreciation. However, affordability remains historically poor, with homeownership accessible to only 35-38% of households nationally (vs. 40-45% pre-pandemic).
This base case assumes no major economic disruptions, continued labor market stability, and Federal Reserve policy that balances inflation concerns against growth support.
Upside Scenario: The Catalysts for Stronger Recovery
Several developments could drive a more robust recovery exceeding base-case expectations:
- Mortgage Rates Drop Below 6%: If inflation continues moderating and the Federal Reserve cuts rates more aggressively than currently anticipated, mortgage rates could fall into the 5.5-5.9% range. This would trigger the psychological threshold effect, bringing marginal buyers off the sidelines. NAR estimates that a drop to 6% would unlock 5.5 million additional qualified buyers, including 1.6 million renters. A drop to 5.5% could double that figure, potentially driving sales 20-25% above 2025 levels.
- Wage Growth Acceleration: If productivity gains from AI and technology drive stronger wage growth (4-5% annually vs. current 3-3.5%), affordability would improve significantly even without rate changes or price moderation. This seems unlikely in the near term but represents a medium-term possibility.
- Policy Interventions: Proposed federal initiatives - whether Trump administration housing reforms, Congressional action on the "Housing for the 21st Century Act," or state/local inclusionary zoning and ADU reforms - could materially increase supply and improve affordability. However, these typically take 2-5 years to manifest in actual housing stock, limiting 2026 impact.
- Inventory Flood from Capitulating Sellers: If enough sellers in tight markets finally accept current pricing reality and list properties at prices buyers will pay, transaction volume could surge even without rate improvements. The risk is that this becomes a self-reinforcing negative cycle (falling prices beget more selling begets further price declines), but managed properly, it could represent a healthy market clearing.
Downside Scenario: Risks to the Recovery
Conversely, several factors could stall or reverse the emerging recovery:
- Economic Recession: A material downturn in employment would overwhelm any positive effects from rate moderation or inventory improvement. Unemployment above 5-6% historically correlates with housing market weakness, both from reduced buyer capacity and forced/distressed selling increasing supply.
- Sticky Inflation and Higher Rates: If inflation remains elevated at 3-4% (above the Federal Reserve's 2% target), the Fed may hold rates higher for longer or even resume hiking. This could push mortgage rates back toward 7-7.5%, choking off the nascent recovery before it gains momentum.
- Geopolitical Shocks: Energy price spikes, trade disruptions from tariffs, or other external shocks could trigger stagflation (high inflation plus low growth) - the worst possible combination for housing markets. Buyers would face both high rates and economic uncertainty, likely retreating from major purchase decisions.
- Price Disconnects Persist: If sellers refuse to adjust prices to match current affordability levels, transaction volumes may remain depressed despite improving rates. This "price discovery failure" has characterized some markets throughout 2024-2025 and could continue in 2026, particularly in markets where sellers have limited urgency to transact.
- Climate and Insurance Shocks: Rising insurance costs in climate-vulnerable markets (discussed in detail in the next section) could create local market crises that spill over into broader market psychology. If insurance becomes unaffordable or unavailable in major markets like Florida or California, it could trigger both supply surges (forced selling) and demand collapses (buyer reluctance), destabilizing affected regions.
Actionable Insights for Market Participants
For Homebuyers:
- First-time buyers: Focus on secondary markets (Raleigh, Charlotte, Columbus, Charleston, Minneapolis) where inventory aligns with income levels. Consider fixer-uppers and properties slightly outside ideal preferences to maximize affordability. Lock in rates when they dip below 6.5%, even if hoping for further declines; the opportunity cost of waiting may exceed the benefit of slightly lower rates later.
- Move-up buyers: If you currently hold a sub-4% mortgage but need to move, evaluate the total cost delta carefully. For moves within the same metro, the rate penalty may be offset by home equity gains. Consider HELOC-based strategies to access equity without refinancing your primary mortgage if renovating your current home is a viable alternative to moving.
- Luxury buyers: High-end markets remain less rate-sensitive due to cash buyer prevalence and high-income borrower qualifications even at elevated rates. Inventory in luxury segments ($1M+) is generally more ample, providing negotiating leverage. This may represent a buyer's market in luxury while entry/mid-tier remain competitive.
For Home Sellers:
- Price realistically from day one: Overpricing leads to extended market time, which triggers buyer suspicion and ultimately necessitates larger price cuts. Use recent comps (last 90 days) from your specific neighborhood, not peak 2022 prices or aspirational comps from superior locations.
- Invest strategically in presentation: In a more balanced market, condition and presentation matter more. Focus on high-ROI improvements: fresh paint, landscaping/curb appeal, minor kitchen/bath updates, and pre-inspection to identify/remedy defects. Avoid over-improving beyond neighborhood norms.
- Time your listing: Spring (March-May) remains peak selling season, but December 2025 data suggests winter selling can work in current conditions if priced appropriately. Consider your local market's inventory levels; if supply is low, you may face less competition listing in off-peak periods.
For Real Estate Agents/Brokers:
- Leverage network effects: In a market where inventory is increasing but still below norms, connecting listings with the right buyers across agent networks provides differentiation. Tools like Blastrow that facilitate agent-to-agent listing promotion enable faster transaction closures and better matches between properties and qualified buyers.
- Educate clients on reality: Both buyers and sellers in 2026 will need realistic expectations. Buyers must understand that 3% rates aren't returning soon; sellers must accept that 2022 prices are history. Agents who can skillfully manage expectations and facilitate transactions under current conditions will thrive.
- Focus on data and micro-markets: National trends provide limited value in a regionally divergent market. Agents with deep neighborhood-level data - absorption rates, price-per-square-foot trends, days-on-market, seasonal patterns - can provide clients with information-driven guidance that generic market commentary can't match.
- Build second-lien expertise: With HELOC volumes surging and many homeowners seeking to tap equity without refinancing primary mortgages, agents who can connect clients with appropriate lending partners and explain HELOC strategies will create additional value beyond traditional buy/sell transactions.
For Investors:
- Geographic selectivity: Avoid one-size-fits-all national strategies. Sun Belt oversupply markets offer contrarian opportunity for patient capital but require careful submarket selection (avoid areas with most severe overbuilding). Northeast/Midwest tight markets offer stability and rental demand but limited appreciation potential. Secondary growth markets (Raleigh, Charlotte, Nashville, Boise) may offer the best risk-adjusted returns.
- Build-to-rent opportunity: With homeownership affordability strained and rental supply tight in many markets, BTR communities offer institutional investors scale opportunities with 5-7% cap rates. However, be mindful of proposed policy changes (potential institutional buyer restrictions) that could impact future exit options.
- Distressed opportunity timeline: Foreclosure activity remains below pre-pandemic norms, and massive equity cushions prevent foreclosure waves. However, pockets of distress may emerge in 2026-2027 among buyers who over-leveraged in 2022 peak markets with minimal down payments. Monitor markets where negative equity is rising (recent purchasers in declining markets).
Conclusion: Navigating the Great Housing Reset
The U.S. housing market stands at a critical juncture in early 2026. After three years of paralysis induced by the mortgage rate lock-in effect, structural forces are finally coalescing to restore more normal market function. The historic crossover in Q3 2025 - when mortgages above 6% exceeded those below 3% for the first time - marks a symbolic and substantive inflection point.
This reset will not happen overnight, nor will it return markets to pre-pandemic conditions. The legacy of 2020-2022's extraordinary disruptions - ultra-low rates, pandemic-driven demand surges, remote work migration, and the subsequent rate shock - will reverberate for years. But the direction of travel is clear: from frozen to flowing, from paralysis to activity, from exceptional to more typical.
For market participants, success in 2026 requires acknowledging several uncomfortable truths:
- 3% mortgage rates are not returning in the foreseeable future; 6-7% represents the new normal
- Home prices will not crash in most markets; structural supply shortages prevent broad deflation even if appreciation slows
- Affordability will remain challenging for entry-level and middle-income buyers; this is now a structural feature, not a transient condition
- Regional outcomes will vary dramatically; national statistics obscure more than they reveal
Within these constraints, however, lies opportunity. Markets are clearing, transactions are resuming, and buyers and sellers are adjusting expectations. The 14% projected increase in home sales for 2026 represents not euphoria but normalization - a modest recovery from generational lows toward still-subdued but more functional activity levels.
The agents, investors, buyers, and sellers who approach 2026 with realistic expectations, data-driven decision-making, and patient capital will find a market rich with possibility. Those clinging to hopes of pandemic-era windfalls or waiting for market crashes that won't materialize will likely be disappointed.
The Great Housing Reset is underway. Understanding its dynamics, constraints, and opportunities will separate winners from waiters in the years ahead.
Frequently Asked Questions (FAQ)
Blastrow
Listing Promotions