
Instagram vs. TikTok vs. YouTube: Where Should Real Estate Agents Publish Listing Videos?
 Mark Newman19 min read
Ask three real estate marketers where to post a listing video and you'll get three confident answers. Instagram is where sellers scroll. TikTok is where the reach is. YouTube is where buyers search. All three are true, which is why the question is so hard to answer. The platforms don't do the same job, and most comparisons measure different things: views against engagement, engagement against intent, intent against actual leads. This guide separates those questions using the largest 2026 platform studies, NAR's buyer data, and Zillow's listing research. The goal is not to crown a winner. It's to tell you which platform earns the first 60 seconds of your next listing video, and which one earns the follow-up.
Key takeaways
Rank video No. 1
4%
of prospective buyers
Rank floor plan No. 1
33%
the top-ranked feature
Used video sites
52%
during their search
U.S. adults on YouTube
84%
90% of $100K+ adults
Seller preference
75%
prefer tour-ready agents
Listing creative in motion: the same property story can become a Reel, a TikTok, a Short, a long-form tour, and a flyer. Source: Blastrow Studio.
On this page
The 30-second answer
There is no single best platform for listing videos in 2026. There is a best first platform for the audience you need to reach next. Instagram is the strongest all-around channel for local seller attention and shares. TikTok is the strongest for cold reach and first-time buyers. YouTube is the strongest for search-intent buyers, relocation, luxury, and evergreen discovery.
If you can only run two platforms, run Instagram and YouTube. Instagram gives you local trust and a shareable video; YouTube gives you a search presence that keeps working after the listing sells. Add TikTok only if you can sustain three to five posts a week and your market includes a meaningful share of younger first-time buyers.
| Your next 12-month goal | First platform | Second | Why |
|---|---|---|---|
| Seller listings and local authority | YouTube | Sellers check Instagram; long-form YouTube proves depth. 75% of sellers are more likely to hire an agent who offers virtual tours or interactive floor plans. | |
| First-time buyers and cold reach | TikTok | 65% of U.S. adults ages 18–29 use TikTok, and small accounts get the most discovery. Instagram catches the 30–49 buyer who checks you out afterward. | |
| Move-up, luxury, and relocation buyers | YouTube | 90% of U.S. adults earning $100,000+ use YouTube, and search behavior signals active intent. Instagram handles the visual tour and seller attention. | |
| Only two platforms | YouTube | The best balance of local trust and search intent. TikTok is optional unless you can sustain three to five posts a week. | |
| Only one platform | YouTube for buyer leads | Instagram for seller attention | The platforms do different jobs. Pick the job that matches your next 12 months, not the platform with the loudest growth story. |
Match the platform to the job
What changed in 2026
The platform story changed in 2026. TikTok still has the largest short-form reach, but its growth cooled. Average views per video fell about 31% year over year in Metricool's 2026 study, while Instagram views rose about 26.6%. TikTok's average engagement rate also slipped from 3.70% to 2.60% in Socialinsider's data, while Instagram Reels held near 0.45% and YouTube Shorts rose to 0.30%.
That does not mean TikTok is dying. It means the platform is maturing. TikTok is still the best place to reach a large cold audience, especially from a small account. But the data no longer supports treating it as the default growth channel for every agent. At the same time, YouTube became the channel that keeps producing views. 61% of YouTube views now come from the Shorts feed, subscribers add another 11%, and long-form videos keep collecting search traffic for months.
| 2026 signal | TikTok | YouTube | |
|---|---|---|---|
| Average views per post | 23,074 | 32,895 | 5,321 (Shorts) |
| Engagement rate | 4.30% | 3.67% | 1.85% |
| Comments per video | 20 | 50 | 10 |
| Share leadership | Leads at every account size | Behind Instagram | Not reported |
| Year-over-year views | +26.6% | −31.3% | Shorts feed = 61% of views |
| Content half-life | 65% of Reel views in 3 days | 96% of views in 10 days | Months to years |
Sources: Metricool 2026 for views and engagement; Socialinsider 2026 for comments; Metricool 2026 for content lifespan. YouTube Shorts figures refer to short-form only.
Platform averages are not your market
What buyers rank first
This is the part most listing-video articles skip. When Zillow asked prospective buyers which listing feature was most important, video did not win. Only 4% ranked video first. Floor plans led at 33%, high-resolution photos followed at 26%, and 3D or virtual tours took 20%.
| Listing feature ranked No. 1 | 2025 share | What it tells you |
|---|---|---|
| Floor plan | 33% | Buyers want to understand flow, size, and fit before they spend a Saturday touring. |
| High-resolution photos | 26% | Photos are still the first quality filter. Video does not rescue a weak photo set. |
| 3D / virtual tour | 20% | Spatial context beats a linear walkthrough for out-of-area and repeat buyers. |
| Written description | 15% | Details still matter, especially for older buyers and relocation searches. |
| Video | 4% | Video helps buyers discover and qualify a property, but it is not the feature they rank first. |
Source: Zillow Consumer Housing Trends Report 2025, prospective buyers (n = 18,100+).
That looks like bad news for video until you pair it with the other number: 52% of buyers used online video sites during their search (NAR 2026). Video is not the feature buyers rank first. It is the format that gets them to the listing page where the features they care about live.
The same Zillow research shows why the destination matters. 82% of buyers are more likely to view a home if the listing includes a floor plan they like. Video earns the click; the floor plan, photos, and 3D tour do the decision work. That is the media hierarchy, and it should shape your platform strategy.
The embeddable version of this hierarchy is in the comparison charts section, along with the platform scorecard.
Video gets attention, not the decision
How listing videos build seller trust
Listing videos are usually discussed as buyer acquisition. For most agents, the faster return is seller acquisition. Zillow's 2026 seller research found that 75% of sellers are more likely to hire an agent who includes virtual tours or interactive floor plans, and 78% say the same about high-resolution photography. A listing video is proof of effort before the listing agreement is signed.
But social video is not the primary way sellers find an agent. In the same Zillow research, only 5% of sellers first found their agent through social media. About 35% found their agent online, including 20% through a real estate site or app, 7% through search, and 5% through social. Another 30% came from a referral. The listing video is the credibility check after the referral or portal lead, not the lead source itself.
| Seller signal | 2026 data | What it means for your platform mix |
|---|---|---|
| Virtual tours or floor plans | 75% more likely to hire | Show the full media bundle in your Instagram and YouTube content rather than a highlight reel. |
| High-resolution photography | 78% more likely to hire | Video should point back to a strong photo set. A cinematic video cannot rescue a weak gallery. |
| Floor plan importance | 78% say highly important | Make the floor plan a headline feature in the listing presentation and the video CTA. |
| Social media discovery | 5% first found agent there | Treat social as a trust check, not the first step in the seller journey. Referral and search still do the acquisition work. |
Buyer-side trust follows the same pattern. Zillow's 2025 prospective-buyer research found that 41% of buyers are more likely to hire an agent with a social media presence. When asked where they prefer to communicate with an agent, 42% chose Instagram and 25% chose TikTok. Instagram is the stronger trust platform for both sides of the transaction; TikTok is the platform for reach.
Your content sells before the listing appointment
Why platform rankings disagree
Read three platform comparisons this year and you have probably seen three different winners. Metricool puts Instagram first on engagement, Socialinsider puts TikTok first by followers, and some studies put YouTube Shorts first on views. They are not necessarily wrong. They measure different things on different samples.
Metricool's 2026 report analyzed 6.18 million videos and found Instagram at a 4.30% engagement rate, TikTok at 3.67%, and YouTube at 1.85%. Socialinsider's 69-million-video study found TikTok at 2.60%, Instagram Reels at 0.45%, and YouTube Shorts at 0.30%. The gap is not a contradiction. Metricool measures interactions against views; Socialinsider measures against followers. TikTok's rate includes shares in one formula and not the other. The denominators are different, so the percentages are different.
| Study | Sample | What it measures | Headline |
|---|---|---|---|
| Metricool 2026 Short-Form Video Report | 6.18M videos, 375K accounts | Views, interactions, engagement rate | TikTok leads reach; Instagram leads engagement and shares |
| Socialinsider 2026 | 69M videos, Jan 2025–Jul 2026 | Engagement and comments, including by length | TikTok leads engagement by followers; Shorts gains |
| Pew Research 2026 | 5,511 U.S. adults | Platform usage by age, income, gender | YouTube reaches 84% of adults; TikTok 37% |
| NAR 2026 Generational Trends | Recent buyers and sellers, Jul 2025–Jun 2026 | Video use in the home search | 52% used video sites; 29% found video very useful |
| Zillow 2025–2026 CHTR | 18,100+ prospective buyers; seller survey | Listing feature preferences and hiring signals | Floor plan 33%, photos 26%, video 4% |
Views do not tell you whether anyone called
Which platform wins each metric
Which platform gets the most engagement depends on the metric. Instagram wins the rate and the share. TikTok wins the volume and the comment. YouTube wins the watch time and the search intent. Each one maps to a different stage of the buyer journey.
| Metric | Winner | 2026 data |
|---|---|---|
| Engagement rate | 4.30% vs TikTok 3.67% vs YouTube 1.85% | |
| Comments per video | TikTok | 50 vs Instagram 20 vs YouTube 10 |
| Average views per post | TikTok | 32,895 vs Instagram 23,074 vs Shorts 5,321 |
| Shares | Leads at every account size; more than double TikTok | |
| Watch time / attention | YouTube | 90% average view rate in Dash Social's all-industry benchmark |
| Search intent | YouTube | 61% of YouTube views come from the Shorts feed; search and suggested add the rest |
| Seller attention | 57% of agents use Instagram professionally; 64% of 30–49 adults use it | |
| First-time buyer reach | TikTok | 65% of 18–29 adults use TikTok; lowest follower barrier |
Sources: Metricool 2026, Socialinsider 2026, Dash Social 2026, Pew Research 2026, and NAR 2026 Member Profile. Engagement rates are not directly comparable across studies.
What each signal means for a listing
| Signal | What it usually means | What to do next |
|---|---|---|
| Save | "I want to remember this property or agent." | Add a clear listing link and a follow-up DM for saves on high-intent videos. |
| Share | "Someone I know should see this." | Make more of that format. Shares are the strongest local distribution signal. |
| Comment | "I have a question or an opinion." | Reply with a video. Comments give you ideas for the next one. |
| Profile visit | "Who is this agent, and what else do they have?" | Make the next three posts proof of local expertise. |
| Link click / DM | "I want details or a conversation." | Respond within minutes, not hours. A fast reply turns interest into a conversation. |
This is why a platform can look "less engaging" and still produce more business. YouTube's 1.85% engagement rate looks small next to Instagram's 4.30%, but a YouTube viewer who searches "living in [city]" and watches eight minutes of a tour is closer to a conversation than a scroller who double-taps a Reel. Measure the signal that matches the job.
Video length and format
"Average" video length is the wrong question. The right question is which length produces the behavior you want. Socialinsider's 2026 data shows a clear split: short clips win engagement, longer clips win views on TikTok, and Reels peak in the 45–60-second range for both.
| Platform | Recommended length | Best format | Why it works |
|---|---|---|---|
| Instagram Reels | 15–45s discovery; 45–60s story | 9:16, captions, 3–5 per week | 45–60s produced the highest engagement and median views in Socialinsider's 2026 data. |
| TikTok | 15–30s hook; 30–60s tour | 9:16, native captions, 3–5 per week | 15–30s wins engagement; 120–180s wins views. Listing tours usually run 30 to 60 seconds. |
| YouTube Shorts | 40–58s | 9:16 teaser with a searchable title | Shorts tease the long-form tour and can surface in search. |
| YouTube long-form | 8–15 min | 16:9, chapters, 1 per week or 3+ per month | Watch time and search intent keep working for months. Cadence matters more than polish. |
Platform maximums change often and vary by account. Do not plan around the upload limit. Plan around the recommendation cutoff. Reels over three minutes are not pushed to new audiences, TikTok can technically host much longer videos but the algorithm rewards retention, and YouTube Shorts can run up to three minutes but a 40–58-second listing teaser usually does the job better.
Six formats worth repeating
The 30-second hero tour
Front door, best room, outdoor space, closing shot. One strong feature per five seconds. Use it as the Reel, TikTok, and Short.
The feature spotlight
One kitchen, one primary suite, one view. A 15–25-second clip that makes the listing page feel worth opening.
The neighborhood walk
Coffee shop, park, school route, commute. This format sells the place, not square footage.
The market update
One chart, one take, one local implication. A 45–60-second Reel or a 6–8-minute YouTube video.
The before/after
Staging, renovation, or prep. If AI altered the property, disclose it and keep the original accessible.
The just-sold story
What sold, why, and what it means for the neighborhood. This is seller content disguised as buyer content.
One production note. If you use AI to add, remove, or change what the property looks like, disclosure rules apply. Our short-form video and AI disclosure guide covers the workflow.
How long each platform's reach lasts
The three platforms distribute content in different ways. TikTok sends new viewers through the For You feed, but most of that attention ends in days. Instagram builds attention through shares, saves, and search. YouTube captures intent through search, suggested video, and a video library that keeps working after the listing is sold.
| Platform | How people find it | How long views last | Best use for a listing |
|---|---|---|---|
| Reels, shares, saves, keyword search | 65% of Reel views in 3 days | Local trust, seller attention, design-led properties, neighborhood stories. | |
| TikTok | For You feed (72.7% of views), search | 96% of views in 10 days | Cold reach, first-time buyers, "what $X buys" comparisons, investor audiences. |
| YouTube | Search, suggested, Shorts feed (61%) | Months to years | Relocation, luxury, move-up buyers, full tours, neighborhood guides. |
TikTok creates new attention, Instagram builds trust and shares, and YouTube captures search demand. If you only have time for one, choose based on whether you need new attention or converted attention. If you have time for two, use Instagram to build the local relationship and YouTube to capture the search.
TikTok reach disappears in days. YouTube search keeps producing views.
Local targeting is the weak spot on TikTok. The For You feed can push your listing to viewers outside your market, which inflates views without producing local showings. Use city and neighborhood text in the first frame, say the location out loud, and keep the CTA local. Instagram and YouTube are easier to anchor to a place because captions, titles, and search terms do more of the targeting work.
Who is buying
Platform choice starts with audience. Pew's 2026 data shows YouTube reaching 84% of U.S. adults, Instagram at 51%, and TikTok at 37%. Age and income matter more than overall reach.
| Platform | U.S. adults | 18–29 | 30–49 | 50–64 | 65+ | $100K+ |
|---|---|---|---|---|---|---|
| YouTube | 84% | 95% | 91% | 85% | 65% | 90% |
| 51% | 79% | 64% | 41% | 21% | 59% | |
| TikTok | 37% | 65% | 45% | 31% | 11% | 29% |
Source: Pew Research Center, Americans' Social Media Use 2026 (n = 5,511).
YouTube is the only one of the three that reaches a majority of every age group and 90% of adults earning $100,000 or more. Instagram is strongest with 30–49-year-olds (64%) and high-income adults (59%). TikTok is strongest with 18–29-year-olds (65%) but reaches only 29% of $100K+ adults. That does not make TikTok useless. It makes it a first-time-buyer and future-buyer channel, not the default channel for move-up or luxury listings.
NAR's 2026 buyer data reinforces the mismatch. The median first-time buyer is now 40, and the median repeat buyer is in their early 60s. The typical buyer is older and wealthier than TikTok's core audience. Meanwhile, 52% of buyers used video sites during their search, and 29% rated listing videos "very useful," behind photos (81%), property details (77%), and floor plans (57%). Video matters, but it is not the only visual format buyers use.
| Audience segment | Best platform | Second | Why |
|---|---|---|---|
| First-time buyers (median age 40) | TikTok | 65% of 18–29 adults use TikTok; Instagram catches the 30–49 crossover. | |
| Move-up buyers (46–60) | YouTube | 85% of 50–64 adults use YouTube; Instagram adds visual discovery. | |
| Luxury and relocation | YouTube | 90% of $100K+ adults use YouTube; search intent is strongest. | |
| Sellers and listing appointments | YouTube | 75% of sellers prefer agents who offer tours or floor plans; Instagram is the trust check. |
Sources: Pew Research 2026 for platform reach; NAR 2026 for buyer age; Zillow 2026 for seller preferences.
Fair housing applies to video targeting too
What to post on each platform
These are starting points, not rigid calendars. The right cadence is the one you can sustain for 90 days without sacrificing the listing work. Consistency matters more than volume. A clear local angle matters more than production polish.
Local trust and seller attention
- Cadence
- 3–5 Reels per week + 3–5 Stories
- Formats
- 30–45s hero Reel, 45–60s story Reel, carousel with photos + floor plan
- Hook
- "What $X buys in [neighborhood]" or "The one feature that sold this house."
- CTA
- Save this for your search. DM TOUR for the full walkthrough.
- Metric
- Saves, shares, profile visits, DMs
- Watch-out
- Posting watermarked TikToks and 30 generic hashtags
TikTok
Cold reach and first-time buyers
- Cadence
- 3–5 per week; 5–7 for growth
- Formats
- 15–30s hook, 30–60s tour, 120–180s story or neighborhood walk
- Hook
- "POV: you have $X in [city]" or "3 things I would never buy in [city]."
- CTA
- Comment TOUR. Follow for part two.
- Metric
- Shares, comments, watch time, profile visits
- Watch-out
- Expecting leads from one viral video with no local offer
YouTube
Search intent and evergreen authority
- Cadence
- 1 long-form per week or 3+ per month; 2–3 Shorts
- Formats
- 8–15 min full tour with chapters; 40–58s Shorts as teasers
- Hook
- "Inside a $X home in [neighborhood]" or "Moving to [city]: what $X buys."
- CTA
- Book a showing. Download the neighborhood guide.
- Metric
- Watch time, search terms, subscribers, link clicks
- Watch-out
- Treating YouTube like TikTok: no searchable title, no chapters, no CTA
Why cadence matters
The comparison charts
Here is the one-page version of the research. The scorecard compares the platforms on reach, engagement, search intent, seller fit, first-time buyer fit, longevity, and best format. The media hierarchy shows why video helps buyers discover a property, but does not replace the listing page.
2026 listing video platform scorecard
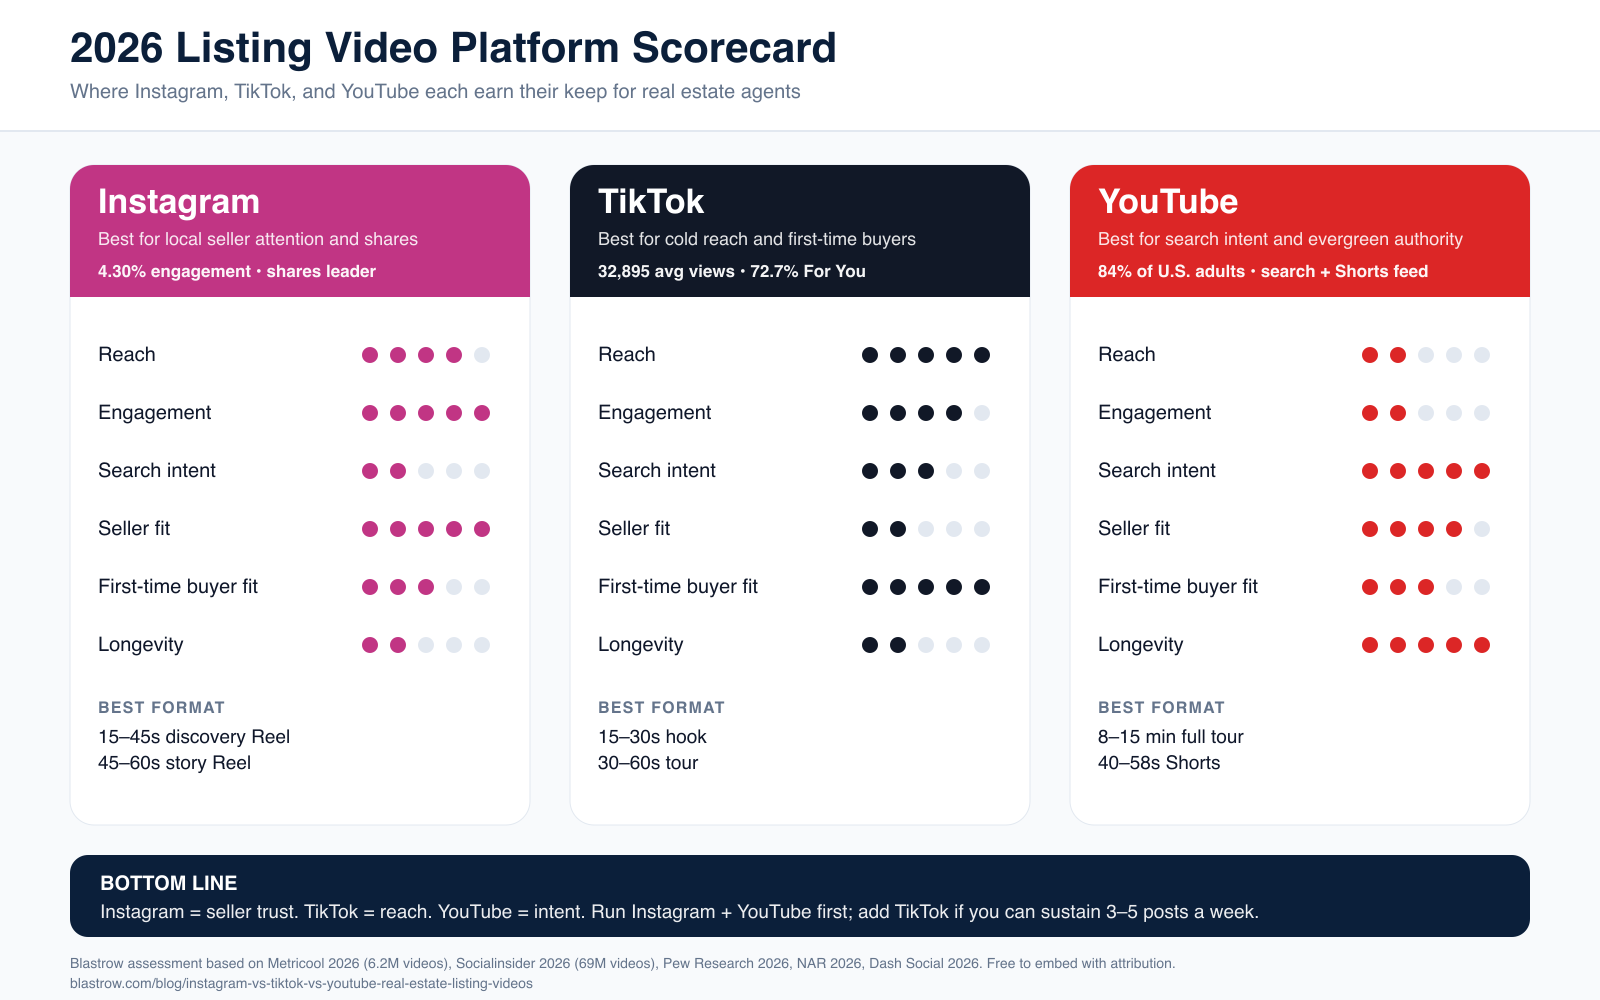
Blastrow assessment based on Metricool 2026, Socialinsider 2026, Pew Research 2026, and NAR 2026. Ratings are directional, not a universal ranking.
| Metric | Instagram Reels | TikTok | YouTube |
|---|---|---|---|
| Average views per post | 23,074 | 32,895 | 5,321 (Shorts) |
| Engagement rate | 4.30% | 3.67% | 1.85% |
| Comments per video | 20 | 50 | 10 |
| Recommended short length | 15–45s / 45–60s | 15–30s / 30–60s | 40–58s |
| Discovery | Reels + shares + search | For You (72.7%) | Search + Shorts feed (61%) |
| Content half-life | ~3 days | ~10 days | Months to years |
| U.S. adult reach | 51% | 37% | 84% |
| $100K+ adult reach | 59% | 29% | 90% |
| Agent adoption | 57% | 16% | 31% |
Sources: Metricool 2026 for views and engagement; Socialinsider 2026 for comments and length; Pew Research 2026 for audience reach; NAR 2026 Member Profile for agent adoption. Engagement definitions differ across studies; compare within a column, not across sources.
Embed the platform scorecard
<p><strong>2026 listing video platform scorecard</strong></p>
<img src="https://www.blastrow.com/img/blog/instagram-vs-tiktok-vs-youtube-real-estate-listing-videos/platform-comparison.png" alt="Comparison of Instagram, TikTok, and YouTube for real estate listing videos" width="1600" height="1000" loading="lazy" />
<p>Source: <a href="https://www.blastrow.com/blog/instagram-vs-tiktok-vs-youtube-real-estate-listing-videos">Blastrow</a></p>
Free to embed with attribution and a link back to this page.
The 2026 listing media hierarchy
The hierarchy explains where video fits. Buyers use video to discover and qualify a property, then rely on photos, floor plans, and 3D tours to decide whether to visit. Build the full set of listing assets, then use the right platform to send traffic to them.
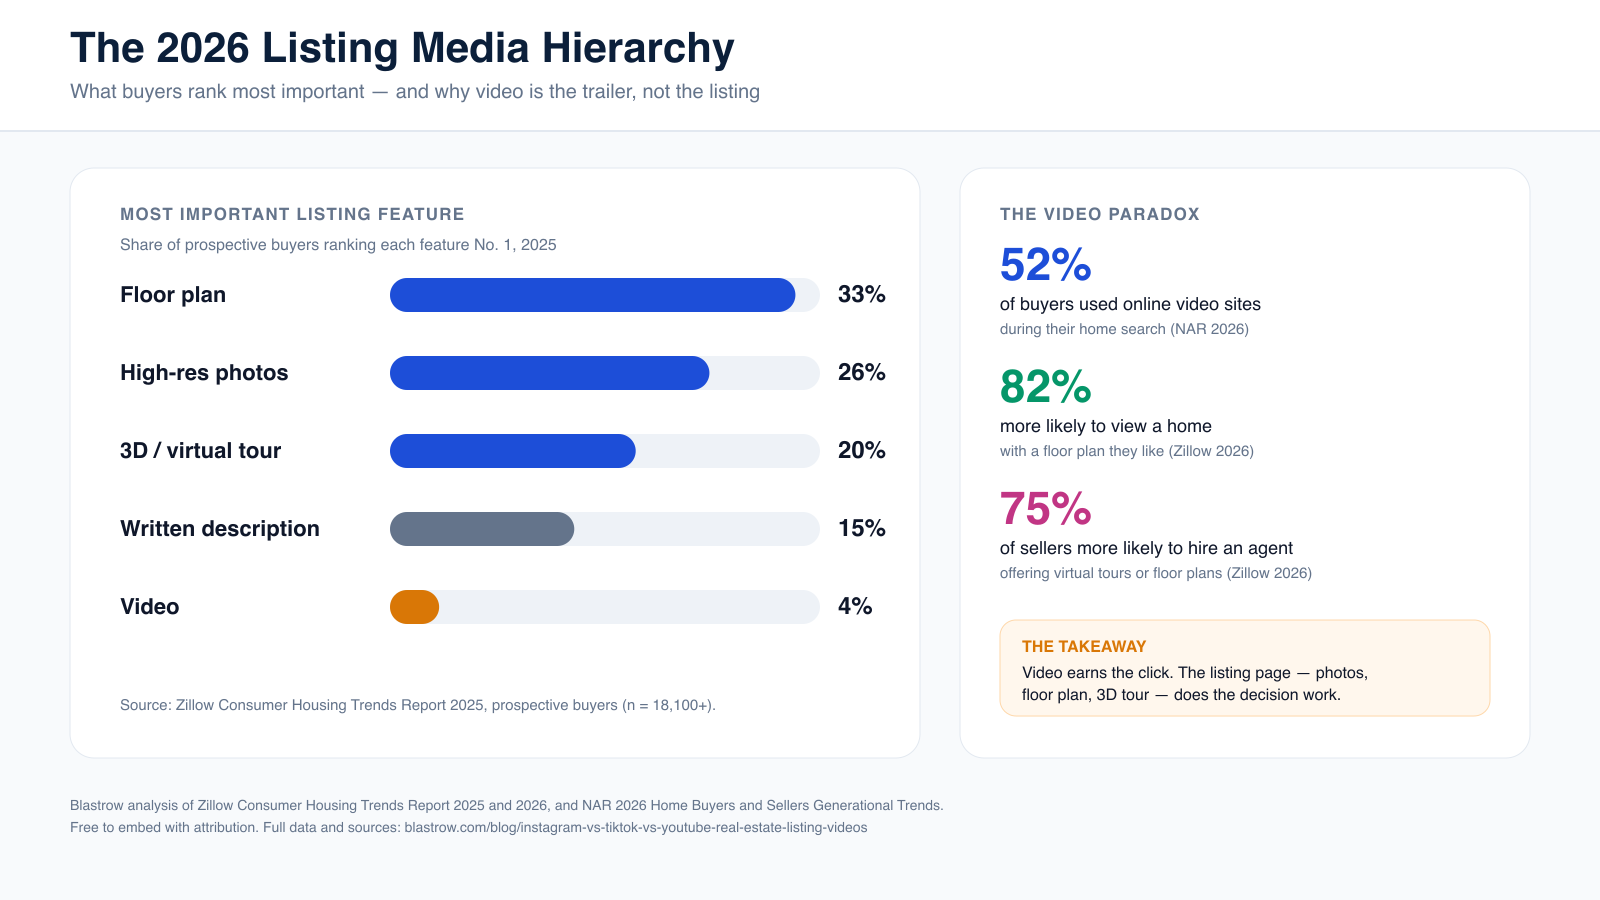
The 2026 listing media hierarchy. Source: Zillow Consumer Housing Trends Report 2025 and 2026; NAR 2026. Free to embed with attribution.
Embed the media hierarchy chart
<p><strong>The 2026 listing media hierarchy</strong></p>
<img src="https://www.blastrow.com/img/blog/instagram-vs-tiktok-vs-youtube-real-estate-listing-videos/media-hierarchy.png" alt="What buyers rank most important in a listing: floor plan 33%, high-resolution photos 26%, 3D virtual tour 20%, written description 15%, video 4%" width="1600" height="900" loading="lazy" />
<p>Source: <a href="https://www.blastrow.com/blog/instagram-vs-tiktok-vs-youtube-real-estate-listing-videos">Blastrow</a>; Zillow Consumer Housing Trends Report 2025 and 2026; NAR 2026.</p>
Free to embed with attribution and a link back to this page.
Cite this page
Blastrow. (2026, November 12). Instagram vs. TikTok vs. YouTube: Where Should Real Estate Agents Publish Listing Videos? https://www.blastrow.com/blog/instagram-vs-tiktok-vs-youtube-real-estate-listing-videos
One shoot, three platforms
The agents who sustain video are not editing every day. They shoot once, cut three masters, and publish natively. Here is the workflow that makes the platform mix manageable.
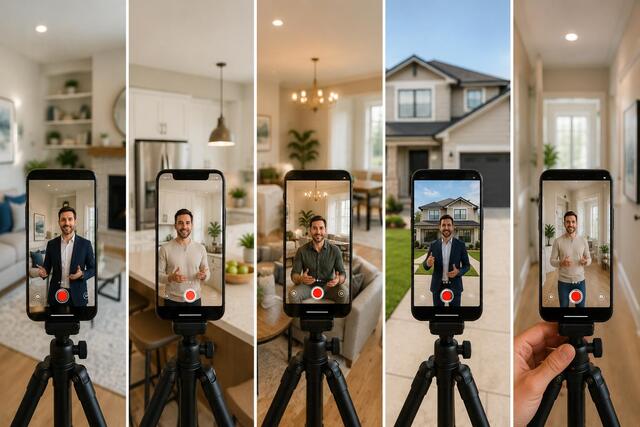
The same shoot covers five rooms and produces multiple cuts for Reels, TikToks, Shorts, the long-form tour, and the listing flyer.
1. Shoot once
Spend 45 minutes on the property. Capture 8–10 vertical clips and one horizontal walkthrough. Shoot the strongest feature first; do not save the best room for the end.
2. Cut three masters
A 30-second vertical hero for Reels and TikTok, a 60-second vertical story for Reels, and a 10–15-minute horizontal tour for YouTube. Keep the clean master; never download a watermarked version.
3. Publish natively
Rewrite the hook, caption, hashtags, and CTA for each platform. Instagram gets the save/share CTA; TikTok gets the comment CTA; YouTube gets the searchable title and link.
4. Repurpose the rest
Cut three Shorts from the long-form tour, turn the floor plan into a carousel, add the video to the listing page, and send it to local agents with the digital flyer.
What to post where
| Asset | TikTok | YouTube | CTA | |
|---|---|---|---|---|
| 30s hero tour | Reel | Video | Short | Save / DM TOUR |
| 60s story tour | Reel | Video | None | Comment TOUR |
| 10–15 min full tour | None | None | Long-form | Book a showing |
| Feature spotlight | Reel + Story | Video | Short | DM for details |
| Neighborhood walk | Reel | Video | Long-form or Short | Download the guide |
| Market update | Reel | Video | Long-form | Ask me a question |
For the full production, hook, caption, and disclosure workflow, see our short-form video guide. For the listing follow-up that turns views into appointments, pair the video with agent-to-agent email and a digital flyer.
Measure views, leads, and showings
The fastest way to waste a listing video budget is to optimize for views. Views tell you the algorithm tested the content. They do not tell you whether the right buyer watched, saved, clicked, or called. Build a simple scorecard that follows the buyer journey.
| Stage | What to watch | Where to find it | If it is low |
|---|---|---|---|
| Reach | Views, reach, impressions | Native analytics | Fix the hook and the first frame |
| Engagement | Saves, shares, comments | Native analytics | Make the video more useful or more specific |
| Intent | Profile visits, link clicks, DMs | Native analytics + UTM | Make the CTA clearer and local |
| Lead | Form fills, calls, texts | CRM + call tracking | Shorten the path and respond faster |
| Appointment | Showings, listing appointments, offers | CRM | Audit follow-up speed and lead quality |
Use a UTM link on every platform, a unique landing page for each listing, and a CRM source field that captures "Instagram," "TikTok," or "YouTube" at the point of contact. If you run calls, use a tracking number or ask every caller how they found you. Attribution does not need to be perfect; it needs to be consistent enough to compare month over month.
Compare your account to its own 90-day baseline
Myths and verdicts
Most listing-video advice is full of numbers that sound authoritative but do not survive a source check. If you use these stats in a listing presentation or client report, use the verified alternatives instead. Verified numbers make a stronger case.
| Claim you will see | Why we left it out | Use instead |
|---|---|---|
| "Listings with video get 403% more inquiries." | Widely repeated, but no published methodology, sample, or year behind the number. | 52% of buyers used video sites; 29% rated video very useful (NAR 2026). |
| "73% of homeowners prefer agents who use video." | Often attributed to NAR, but NAR's buyer and seller surveys do not ask this question. | 75% of sellers are more likely to hire an agent offering virtual tours or floor plans (Zillow 2026). |
| "Homes with video sell 32% faster." | No public study isolates video from price, condition, and marketing budget. | Zillow's 3D tour data: 37% more views and 46% more saves (2021, tours not video). |
| "TikTok is only for Gen Z." | 37% of U.S. adults use TikTok, including 45% of 30–49-year-olds. | TikTok skews younger and lower-income, but it is not a single-generation platform. |
| "YouTube is the second-largest search engine." | A popular shorthand, not an official ranking. Search behavior still matters. | YouTube reaches 84% of U.S. adults and is owned by Google; treat it as a search and discovery channel. |
The verdict by agent type
| Agent situation | First platform | Second | Why |
|---|---|---|---|
| New agent, no audience | YouTube Shorts | Local network plus search longevity; TikTok only with consistent output | |
| Listing agent, seller focus | YouTube long-form | Seller attention plus authority | |
| First-time buyer specialist | TikTok | Youngest buyer reach plus a trust check | |
| Luxury and relocation | YouTube | High-income reach and search intent | |
| Team with a videographer | YouTube | Instagram + TikTok | Anchor long-form, then cut for reach |
| Low bandwidth | YouTube Shorts | One vertical shoot, two platforms |
Based on the audience, reach, and lead-quality data in this guide. Your market, price point, and existing audience should override the generic recommendation.
Use the platforms in order. Instagram builds local trust and seller attention. YouTube captures search intent and creates a video library. TikTok adds reach when you have the cadence and audience to support it. Then send every view to a listing page that has the photos, floor plan, and 3D tour buyers rank highest.
Do this next
- Pick your first platform based on the audience you need next, not the one with the loudest growth story.
- Shoot one listing this week and cut the 30-second hero, 60-second story, and long-form tour.
- Add the floor plan and photo gallery to the landing page before you publish the video.
- Set up UTMs and a CRM source field so every DM and click ties back to a platform.
- Review the scorecard after 30 days and focus more on the platform that produced conversations, not views.
Frequently asked questions
Where should real estate agents publish listing videos in 2026?
Is TikTok worth it for real estate agents?
How long should a real estate listing video be?
Which platform produces the most leads from listing videos?
Should agents post the same listing video on Instagram, TikTok, and YouTube?
What should agents measure beyond views?
Do you need a big following to get reach on listing videos?
What is the best platform for luxury or relocation listing videos?
Data notes and sources
This guide uses platform-wide studies, national survey data, and real estate-specific research. None of the sources is a controlled experiment on listing videos, and platform algorithms change monthly. Treat the numbers as directional evidence, not guarantees.
| Source | Sample | Period | What it measures |
|---|---|---|---|
| Metricool 2026 Short-Form Video Report | 6.18M videos, 375K accounts | 90-day window to Aug 2026 | Views, interactions, engagement, shares |
| Socialinsider 2026 | 69M videos, Jan 2025–Jul 2026 | Jan 2025–Jul 2026 | Engagement and comments, including by length |
| Pew Research Center 2026 | 5,511 U.S. adults | Jan–Jun 2026 | Platform usage by age, income, gender |
| NAR 2026 Home Buyers and Sellers Generational Trends | Recent buyers and sellers | Jul 2025–Jun 2026 | Video use in the home search |
| NAR 2026 Member Profile | Realtors | 2026 | Professional platform adoption |
| Zillow Consumer Housing Trends Report 2025 | 18,100+ prospective buyers | Mar–Sep 2025 | Listing feature preferences and agent hiring signals |
| Zillow Consumer Housing Trends Report 2026 | Recent sellers | 2026 | Seller priorities, tours, floor plans, agent hiring |
| Knwn Local / Beacon / Listing Leads 2026 | 462 working agents, self-selected | May 2026 | Lead outcomes by channel and content cadence |
| Dash Social 2026 benchmarks | 3,000+ brands, all industries | Jul 2025–Jun 2026 | Watch time, reach, engagement |
Limitations: platform studies mix industries and account sizes; real estate-specific samples are smaller and often self-selected; engagement definitions differ; survey data is correlational. We excluded widely repeated statistics such as "403% more inquiries" and "73% more likely to list" because we could not find a published methodology, sample, or year behind them.
This page is informational, not legal or financial advice. Platform rules, ad policies, and disclosure requirements change. Confirm current requirements with your broker, MLS, and state regulator before publishing.

Blastrow
Listing Promotions